Special SKI Report #213 Special SKI Report #213
Gold Stock Update Jeffrey M. Kern, Ph.D.
Email: jeff@skigoldstocks.com
USERX | historicals
Written Sunday Dec 23, 2018
Published Dec 24, 2018 Current USERX price = 6.42, Down 2 cents but with a 2% dividend payout since the last report 4 weeks ago. Introduction (repeated from prior Reports):
I have been using my unique SKI indices
to predict price changes in the precious metals' market for more
than two decades. And my indices continue to mark the critical
points. I have initiated a subscription website since 1/13/06
(yes, Friday the 13th) after having posted free updates for years
at www.321gold.com. SKI is a timing service; although
almost everyone seems to believe that market timing is impossible,
that IS what the SKI indices have done for 36 years.
The SKI indices contain short-term (16-20
trading days), intermediate-term (35-39 trading days), and long-term
(92-96 trading days) indices. A more comprehensive description
of these mathematical indices and their history is found here.
Basically, the indices compare today's price to prices from a
specified prior time period. The name of the index specifies the
time period (e.g., 92-96 index = compare today's price to prices
from 96, 95, 94, 93, and 92 trading days earlier). Although I
use the oldest gold mutual fund, USERX, for analyses, the predictions
are applicable to the broad precious metals' market. I do not
recommend or analyze specific stocks, but my subscribers from
around the world regularly discuss individual issues on our Forum.
In addition to the truly unique SKI indices, I also use "run
patterns" to guesstimate turning points in the precious metals'
market. A "run" refers to a pattern of daily up and
down market closing prices. If the market has 3 consecutive days
of higher closing prices, the run is "3 up". If prices
then decline for 2 consecutive days, the run becomes "3 up
and 2 down". If prices then close higher the next day, the
run changes to "2 down and 1 up". Some people have referred
to run patterns as "worms". A run pattern is only completed
after the direction of closing prices has changed. I have compiled
a listing of every run pattern that has ever occurred and generated
probabilities that the end of the run marks a high or a low, moderated
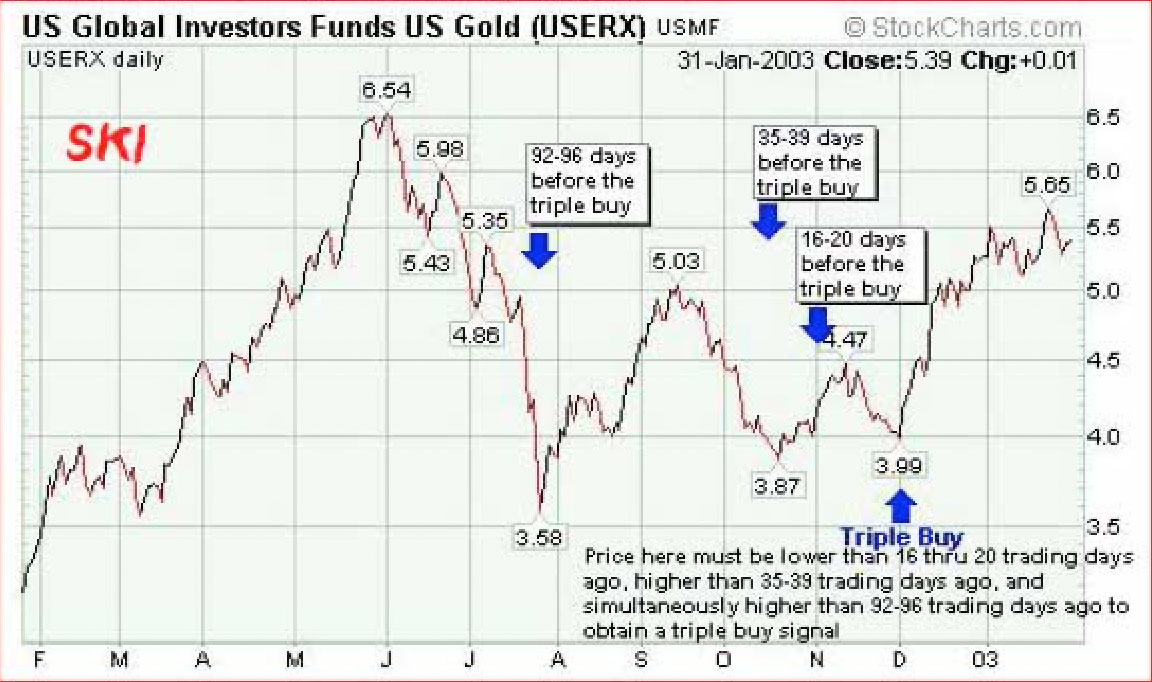
by the indices themselves. New Material The last SKI Report (written on November 25, 2018) described how the very long-term USERX 663 index had generated a buy signal on 11/13/18 for execution the next day at USERX 6.28. The 663 index is a contrarian index that buys on declines. It may have rather exactly marked a long-term low, especially if USERX did not decline back below 6.25. Jeff was looking for buy signals from the regular SKI indices (the 16-20, 35-39, and/or 92-96 indices) to confirm the potential long-term bottom. This can be a rather brief Report. The gold stocks declined immediately after that Report, but the decline stopped on 11/27/18 at exactly USERX 6.25. The 6.25 level held and the precious metals sector has risen since then. The rise has been led by the larger capitalization gold stocks as per GDX and the HUI. USERX has behaved more in line with GXJ and the rise has been meager. But as per the conclusions of the last Report, “there isn’t any requirement that the 663 index’s buy signal yield an immediate powerful rise because it is such a long-term index”. The rise did generate the first regular index signal, a 16-20 index sell signal as USERX rose over the prices from 16-20 trading days earlier. That signal is first resistance, but it is also required for any bullish case. Conclusion Now, a rise OR a decline will generate a regular SKI buy signal. A decline will give a 16-20 index buy signal (since that contrarian index buys on declines). A small rise will generate a 35-39 index buy signal (as USERX rises over the prices from 35-39 trading days earlier). But there are even more bullish possibilities including a true bull market 92-96 index buy signal or a Triple Buy index pattern. SKI became rather infamous back in December 2002 when I wrote the Triple Buy article. That Triple Buy index pattern and the accompanying Update is reprinted in the free historical section of the SKI website here. The chart below is a brief summary. (Click on image to enlarge)  It has NOT happened yet, but we’ll soon see! Happy Holidays and Best Wishes, Jeff If you are interested in following and learning more about the SKI indices, I'll write another Report in three weeks or you can shell out the big bucks for a SKI subscription. Weekly Updates are available by subscribing for a month (or longer if you're wise and cheap enough to want to save money) at my website www.skigoldstocks.com for the princely sum of $25 (for a one month subscription) or more ($200 for an annual subscription). I also provide more frequent intra-week daily messages/alerts at a slightly higher price along with access to our informative Forum. ###  SKI archives SKI archives
email: jeff@skigoldstocks.com
Jeffrey M. Kern,Ph.D., is an academic psychologist with a specialty in the measurement and prediction of human behavior. The communications provided are for informational purposes only and are not intended to be investment advice or recommendations for specific investment decisions. Dr. Kern is not a registered investment advisor, but is registered as a commodity trading advisor (CTA). The information provided is considered accurate, but cannot be guaranteed. Investments/trading in narrow market segments or gold futures is for individuals willing to accept a higher level of risk for the opportunity of greater returns. Past performance is no guarantee of future performance. His website is www.skigoldstocks.com.
Communications should be sent to: jeff@skigoldstocks.com.
Copyright © 2002-2024 Jeffrey Kern. All Rights Reserved. 321gold Ltd

|