 Special SKI Report #179 Special SKI Report #179
Gold Stock Update: Time is Expiring Jeffrey M. Kern, Ph.D.
Email: jeff@skigoldstocks.com
USERX | historicals
Written Sunday Dec 11, 2016
Published Dec 12, 2016 Current USERX price = 7.39, Up 6 cents (.9%) since the last report 3 weeks ago. Introduction (repeated from prior Reports):
I have been using my unique SKI indices
to predict price changes in the precious metals' market for more
than two decades. And my indices continue to mark the critical
points. I have initiated a subscription website since 1/13/06
(yes, Friday the 13th) after having posted free updates for years
at www.321gold.com. SKI is a timing service; although
almost everyone seems to believe that market timing is impossible,
that IS what the SKI indices have done for 36 years.
The SKI indices contain short-term (16-20
trading days), intermediate-term (35-39 trading days), and long-term
(92-96 trading days) indices. A more comprehensive description
of these mathematical indices and their history is found here.
Basically, the indices compare today's price to prices from a
specified prior time period. The name of the index specifies the
time period (e.g., 92-96 index = compare today's price to prices
from 96, 95, 94, 93, and 92 trading days earlier). Although I
use the oldest gold mutual fund, USERX, for analyses, the predictions
are applicable to the broad precious metals' market. I do not
recommend or analyze specific stocks, but my subscribers from
around the world regularly discuss individual issues on our Forum.
In addition to the truly unique SKI indices, I also use "run
patterns" to guesstimate turning points in the precious metals'
market. A "run" refers to a pattern of daily up and
down market closing prices. If the market has 3 consecutive days
of higher closing prices, the run is "3 up". If prices
then decline for 2 consecutive days, the run becomes "3 up
and 2 down". If prices then close higher the next day, the
run changes to "2 down and 1 up". Some people have referred
to run patterns as "worms". A run pattern is only completed
after the direction of closing prices has changed. I have compiled
a listing of every run pattern that has ever occurred and generated
probabilities that the end of the run marks a high or a low, moderated
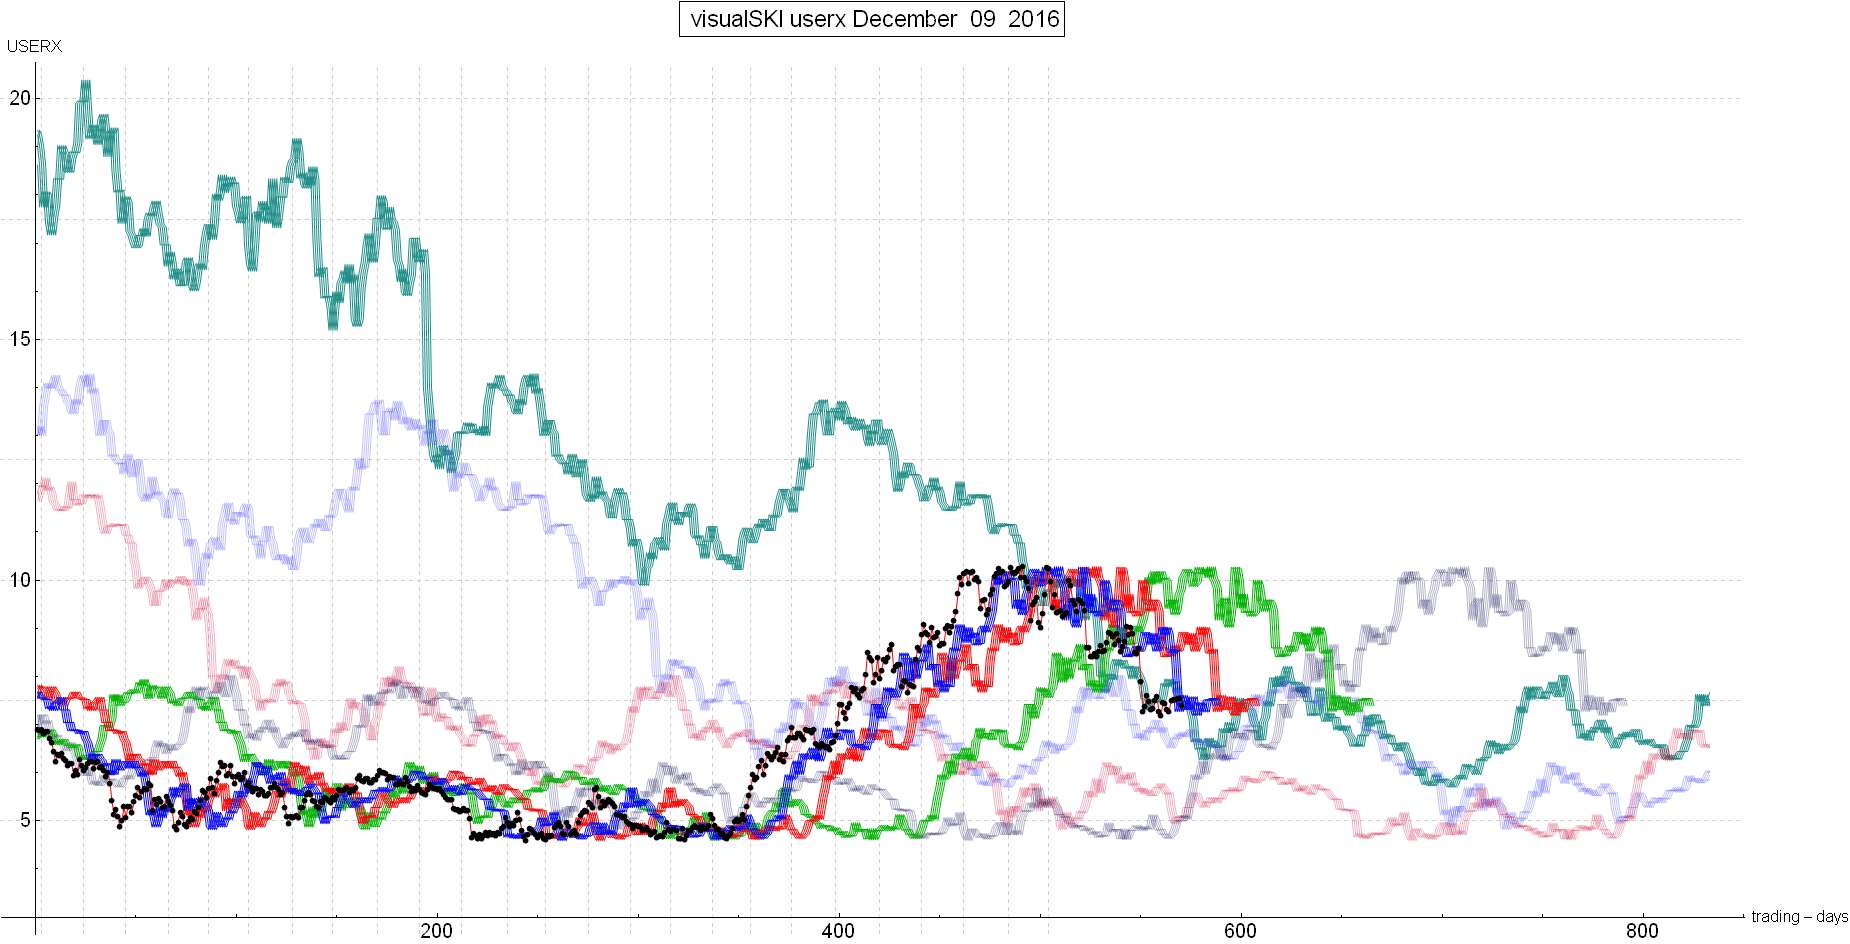
by the indices themselves. New Material The last SKI Report, written on Sunday 11/20/16, described how the gold stocks had plunged again (as was “truly” expected due to the SKI index signals) into a 16-20 index buy signal that executed on 11/11/16 at USERX 7.27. Yes, it was a “buy” signal, but the SKI rules had XXed Out the buy signal, meaning that it was a dangerous buy that could fail and yield yet another plunge. Nonetheless, that buy signal was supposed to mark the next technical point: The index signal had a 60% historical probability of yielding a profitable rise (albeit small; usually 3-8%) into a 16-20 index sell signal about 20 trading days after the signal, but it also had a 40% probability of failing. The Report concluded that: “The XXed Out 16-20 index buy signal on 11/11/16 at USERX 7.27 HAS marked the exact low-to-date. The next technical point will occur in 3-5 trading days: If the gold stocks can hold the 11/11/16-11/14/16 lows, prices should rise (mildly) into another resistance 16-20 index in several weeks, and the XXing Out of the 16-20 index’s buy signal will have been incorrect (but still would have been historically judicious and risk-averse). And then, a decline would turn SKI/Jeff bullish. Alternatively, if the gold stocks decline below that low in 3-5 trading days from now, a further 20-30% decline should be in progress”. The 3-5 day time period was based upon SKI’s Half-Cycle Theory. The buy signal was based upon the 16-20 index and one-half of 16-20 trading days is 8-10 trading days from the 11/11/16 buy signal (3-5 trading days from when that Report was written). If USERX was clearly above 7.27 at the half-cycle, the historical probabilities would improve to 80% for a rise into a profitable 16-20 index sell signal, but if USERX was below the 7.27 buy-in price at half-cycle, the odds would strongly favor that another plunge was beginning. More importantly, for the “bigger picture”, that last Report concluded that IF “the gold stocks can rise (mildly) for a few weeks into a 16-20 index resistance sell signal, a subsequent decline would turn SKI back to clearer bullishness for the first time in many months”. What then happened? The gold stocks rose 3-4% over the next 2 trading days to USERX 7.58 on 11/22/16 and then, as the half-cycle period began, they dropped a solid 4%. USERX closed at 7.26, 1-penny below the 7.27 technical number, and the odds that a new large decline was beginning had increased. I received numerous emails from 321gold readers, asking if the large decline had begun, but I was unable to provide an answer because WHAT MATTERS IS THE PRICE AT THE END OF THE HALF-CYCLE PERIOD. USERX then declined again the next trading day (11/25/16) to 7.19 on the 9th day of the half-cycle period. The final critical technical day would then be on Day 10: Would the gold stocks continue to decline for Armageddon, or would they rise 3+% to get USERX back to clearly above the index’s buy-in price of 7.27? Jeff did not “know”, but USERX then rose 3.8% on Day 10 (11/28/16) to complete the half-cycle period in a bullish manner. The Day 10 rise yielded the 80% probability that the gold stocks would rise into a 16-20 index resistance sell signal at around 20 trading days from the 11/11/16 XXed Out buy signal. Historically, that 20–day period sometimes extends to 21-22 trading days because the index executes one trading day after the signal generates. IT IS NOW DAY 19 FROM THAT BUY SIGNAL. USERX and the HUI rose last week to hit/touch the 16-20 index, moving it towards its 16-20 index sell signal. Again, the index signal is resistance, but it is needed for the structure of the SKI indices to turn to the bullish side such that a new decline OR a rise would generate a buy signal. Here’s the graph of the SKI indices for USERX. The black dots are the USERX prices, the blue line is the resistance 16-20 index, and the turquoise line is the long-term resistance 880-884 index that is synchrony with the 16-20 index and has stopped all rises since the exact August top at USERX 10.28. Note how USERX has risen to the exact index lines, but has NOT gotten over those lines. Therefore, the next 1-3 trading days should/will decide the bigger issue, in synchrony with the market’s reaction to the 12/14/16 U.S. Federal Reserve announcement. I strongly recommended subscribing 6 weeks ago and that was exact. I specifically did not recommend subscribing 3 weeks ago because the situation was uncertain. The gold stocks have essentially been flat since then. I am likely to be better at “timing the timer” (SKI/Jeff) than you are. The situation remains tenuous and Jeff cannot yet provide a clear conclusion, BUT TIME HAS JUST ABOUT EXPIRED. Yes, the gold stocks have held up despite the continuing decline in gold and that is usually bullish, but Jeff relies upon the SKI indices, and the next market phase won’t begin for another 1-3 trading days. If the gold stocks can rise solidly in that time frame, the index signals will generate. That can still be a top on the execution of the index resistance signals, but SKI would be primed for bullishness even if there is a subsequent decline. Note how the turquoise 884 index line is about to plunge: If the rise occurs now into the index signals and then a decline occurs, the 16-20 index and the 884 index would buy on the decline (usually marking the final low with a mean of zero trading days [exact] and a standard deviation of 1 trading day [that equals a 95% probability of marking the low to within plus or minus 2 trading days]. Accept the immediate uncertainty. The only clarity that I can provide as of today is that a close below USERX 7.19 should be bearish. Mechanical SKI is in cash after having bought for a potential bull market on 1/26/16 at USERX 4.99 and having sold on 10/25/16 at USERX 8.90. Best Wishes, Jeff If you are interested in following and learning more about the SKI indices, I'll write another Report in three weeks or you can shell out the big bucks for a SKI subscription. Weekly Updates are available by subscribing for a month (or longer if you're wise and cheap enough to want to save money) at my website www.skigoldstocks.com for the princely sum of $25 (for a one month subscription) or more ($200 for an annual subscription). I also provide more frequent intra-week messages/alerts at a slightly higher price along with access to our informative Forum and a managed gold futures program. The precious metals are in a very long-term (decade+) up-trend but are the most precarious, volatile, and psychologically difficult market in the world (in my opinion). That's the way it's always been. ###  SKI archives SKI archives
email: jeff@skigoldstocks.com
Jeffrey M. Kern,Ph.D., is an academic psychologist with a specialty in the measurement and prediction of human behavior. The communications provided are for informational purposes only and are not intended to be investment advice or recommendations for specific investment decisions. Dr. Kern is not a registered investment advisor, but is registered as a commodity trading advisor (CTA). The information provided is considered accurate, but cannot be guaranteed. Investments/trading in narrow market segments or gold futures is for individuals willing to accept a higher level of risk for the opportunity of greater returns. Past performance is no guarantee of future performance. His website is www.skigoldstocks.com.
Communications should be sent to: jeff@skigoldstocks.com.
Copyright © 2002-2024 Jeffrey Kern. All Rights Reserved. 321gold Ltd

|
