 Special SKI Report #194 Special SKI Report #194
Gold Stock Update Jeffrey M. Kern, Ph.D.
Email: jeff@skigoldstocks.com
USERX | historicals
Written Sunday Nov 5, 2017
Published Nov 6, 2017 Current USERX price = 7.34, Down 73 cents (9%) since the last report 3 weeks ago. Introduction (repeated from prior Reports):
I have been using my unique SKI indices
to predict price changes in the precious metals' market for more
than two decades. And my indices continue to mark the critical
points. I have initiated a subscription website since 1/13/06
(yes, Friday the 13th) after having posted free updates for years
at www.321gold.com. SKI is a timing service; although
almost everyone seems to believe that market timing is impossible,
that IS what the SKI indices have done for 36 years.
The SKI indices contain short-term (16-20
trading days), intermediate-term (35-39 trading days), and long-term
(92-96 trading days) indices. A more comprehensive description
of these mathematical indices and their history is found here.
Basically, the indices compare today's price to prices from a
specified prior time period. The name of the index specifies the
time period (e.g., 92-96 index = compare today's price to prices
from 96, 95, 94, 93, and 92 trading days earlier). Although I
use the oldest gold mutual fund, USERX, for analyses, the predictions
are applicable to the broad precious metals' market. I do not
recommend or analyze specific stocks, but my subscribers from
around the world regularly discuss individual issues on our Forum.
In addition to the truly unique SKI indices, I also use "run
patterns" to guesstimate turning points in the precious metals'
market. A "run" refers to a pattern of daily up and
down market closing prices. If the market has 3 consecutive days
of higher closing prices, the run is "3 up". If prices
then decline for 2 consecutive days, the run becomes "3 up
and 2 down". If prices then close higher the next day, the
run changes to "2 down and 1 up". Some people have referred
to run patterns as "worms". A run pattern is only completed
after the direction of closing prices has changed. I have compiled
a listing of every run pattern that has ever occurred and generated
probabilities that the end of the run marks a high or a low, moderated
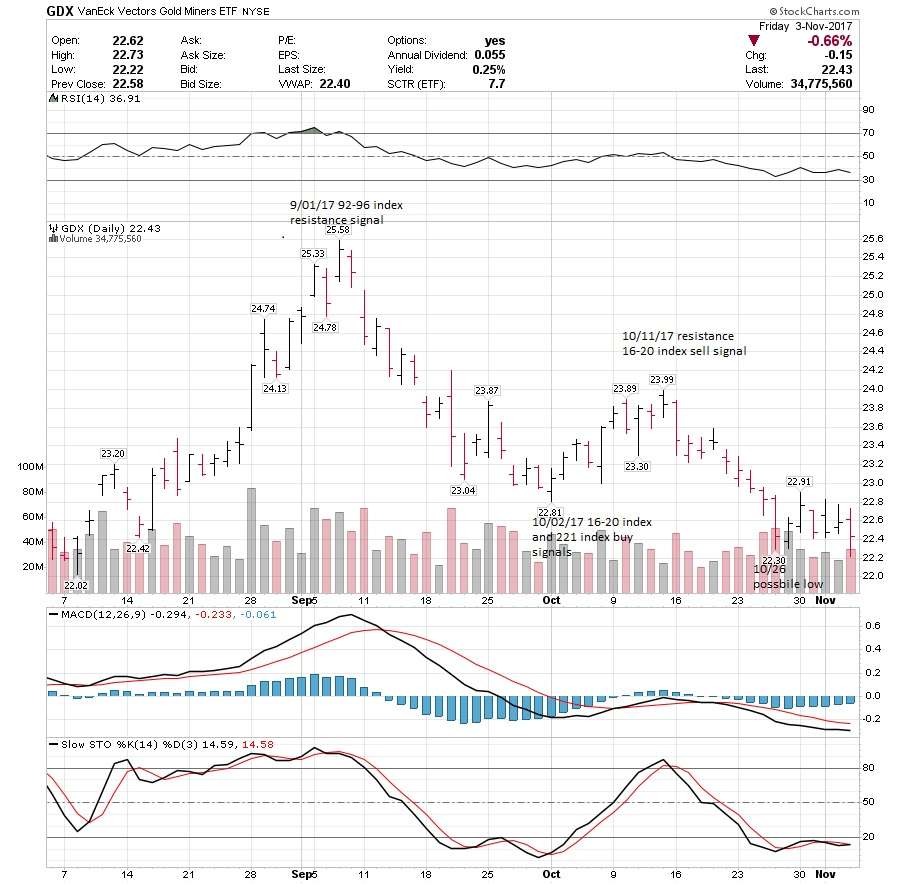
by the indices themselves. New Material The last SKI Report, written on Sunday 10/15/17, described how the gold stocks (i.e., the mutual fund USERX) had generated two simultaneous buy signals (a short-term 16-20 index buy signal and a longer-term 221 index buy signal) at a rather exact low on 10/02/17 that were clearly buyable, but had risen into a short-term index sell signal on 10/11/17 where Jeff did some selling. The conclusion was uncertain and awaited further market behavior over the subsequent two weeks: A rise over the 10/11/17 high would be quite bullish but a further decline could yield a second short-term buy signal or could stop out Mechanical SKI’s early August intermediate-term (35-39 index) buy signal. The gold stocks simply declined during the subsequent week to generate a short-term 16-20 buy signal but also the 35-39 index’s intermediate-term sell signal that did stop out Mechanical SKI’s early August buy. Since it was obvious (99% probability) that the 35-39 index was going to sell, and since prices usually decline into such a sell signal, Jeff completed selling on 10/23/17. The decline continued into Thursday, 10/26/17 at USERX 7.33. USERX had declined for an extended run down of 7 consecutive trading days. Such a 1 Up and 7 Down run pattern had never marked an exact low since 1974, but the decline had been strong enough to hit/touch the 92-96 index and had come within one day of generating a 221 index sell signal (the 221 index is the long-term SKI System’s master index). Therefore, that appeared to be “some type” of low but it was still unclear what type of low (i.e., just a short-term low or a more significant low). Mechanical SKI and Jeff remained in cash awaiting more information. The gold stocks have gone sideways since the 10/26/17 technical point and it will take a little more time to make a clear prediction. The following chart portrays the intermediate-term picture. USERX is currently at 7.33 and is sitting just above the master 92-96 index with its back prices for this coming week at: | Monday (11/06/17): | 7.21, 7.20, 7.32, 7.29, 7.31 | | Tuesday (11/07/17): | 7.20, 7.32, 7.29, 7.31, 7.37 | | Wednesday (11/08/17): | 7.32, 7.29, 7.31, 7.37, 7.25 | | Thursday (11/09/17): | 7.29, 7.31, 7.37, 7.25, 7.22 | | Friday (11/10/17): | 7.31, 7.37, 7.25, 7.22, 7.14 | Three days below USERX 7.29 will generate a 92-96 index sell signal during this coming week. That would not be bullish, but the index’s back prices are declining (as per the 7.14 price at the end of this coming week and then a decline to 7.04, 7.02, 6.87, 7.07, and 7.06 during the following week). Therefore, A QUICK 92-96 INDEX SELL SIGNAL FOLLOWED BY A SMALL BRIEF RISE WOULD GENERATE A NEW BUYABLE 92-96 INDEX BUY SIGNAL FOR BULLISHNESS. The second possibility is that the gold stocks will avoid the 92-96 index’s sell signal. If such a sell signal is avoided over the next week, the situation would also be quite bullish. The third possibility is the simply bearish possibility that the gold stocks will decline during this coming week to generate the 92-96 index’s sell signal and continue to decline to avoid a new 92-96 index buy signal. Such a decline is still likely to remain above the December 2016 low at USERX 6.42 and constitute the final corrective decline from the Summer 2016 top at USERX 10.28. SKI mandates a little more patience here. Best Wishes, Jeff If you are interested in following and learning more about the SKI indices, I'll write another Report in three weeks or you can shell out the big bucks for a SKI subscription. Weekly Updates are available by subscribing for a month (or longer if you're wise and cheap enough to want to save money) at my website www.skigoldstocks.com for the princely sum of $25 (for a one month subscription) or more ($200 for an annual subscription). I also provide more frequent intra-week daily messages/alerts at a slightly higher price along with access to our informative Forum. ###  SKI archives SKI archives
email: jeff@skigoldstocks.com
Jeffrey M. Kern,Ph.D., is an academic psychologist with a specialty in the measurement and prediction of human behavior. The communications provided are for informational purposes only and are not intended to be investment advice or recommendations for specific investment decisions. Dr. Kern is not a registered investment advisor, but is registered as a commodity trading advisor (CTA). The information provided is considered accurate, but cannot be guaranteed. Investments/trading in narrow market segments or gold futures is for individuals willing to accept a higher level of risk for the opportunity of greater returns. Past performance is no guarantee of future performance. His website is www.skigoldstocks.com.
Communications should be sent to: jeff@skigoldstocks.com.
Copyright © 2002-2024 Jeffrey Kern. All Rights Reserved. 321gold Ltd

|
