 Special SKI Report #125 Special SKI Report #125
Gold Stock Update: Positive, but Resistance Coming Again
Jeffrey M. Kern, Ph.D.
Email: jeff@skigoldstocks.com
USERX
| historicals
Written Aug 25, 2013
Published Aug 26, 2013
Current USERX price = 8.10, Up 66 cents (8.9%) since the last report 4 weeks ago.
Introduction (repeated from prior Reports):
I have been using my unique SKI indices
to predict price changes in the precious metals' market for more
than two decades. And my indices continue to mark the critical
points. I have initiated a subscription website since 1/13/06
(yes, Friday the 13th) after having posted free updates for years
at www.321gold.com. SKI is a timing service; although
almost everyone seems to believe that market timing is impossible,
that IS what the SKI indices have done for 36 years.
The SKI indices contain short-term (16-20
trading days), intermediate-term (35-39 trading days), and long-term
(92-96 trading days) indices. A more comprehensive description
of these mathematical indices and their history is found here.
Basically, the indices compare today's price to prices from a
specified prior time period. The name of the index specifies the
time period (e.g., 92-96 index = compare today's price to prices
from 96, 95, 94, 93, and 92 trading days earlier). Although I
use the oldest gold mutual fund, USERX, for analyses, the predictions
are applicable to the broad precious metals' market. I do not
recommend or analyze specific stocks, but my subscribers from
around the world regularly discuss individual issues on our Forum.
In addition to the truly unique SKI indices, I also use "run
patterns" to guesstimate turning points in the precious metals'
market. A "run" refers to a pattern of daily up and
down market closing prices. If the market has 3 consecutive days
of higher closing prices, the run is "3 up". If prices
then decline for 2 consecutive days, the run becomes "3 up
and 2 down". If prices then close higher the next day, the
run changes to "2 down and 1 up". Some people have referred
to run patterns as "worms". A run pattern is only completed
after the direction of closing prices has changed. I have compiled
a listing of every run pattern that has ever occurred and generated
probabilities that the end of the run marks a high or a low, moderated
by the indices themselves.
New Material
The last gold stock SKI Report, written on Sunday 7/28/13, described how the SKI index “structure” was turning bullish. Essentially, since the index-marked high on 7/22/13 – 7/23/13, a continuing decline into the middle of August would generate a 16-20 index buy signal and a rise over a couple of weeks would generate an intermediate-term 35-39 index buy signal. The last SKI Report also described how both index buy signals could simultaneously generate for an even more clearly bullish “Double Buy” index pattern.
After that 7/28/13 Report, the gold stocks simply continued to decline. USERX declined for an additional 7 consecutive days to form an extremely stretched 1 Up and 8 Down run pattern. The HUI’s continuing decline formed a 2 Up and 8 Down run pattern. The HUI’s rather rare run pattern can (not “will”) form important lows in the same manner that the special 2 Up and 5 Down USERX run pattern may have marked the major low in late June 2013.
More importantly, the decline into 8/07/13 caused USERX to decline to 6.69 and the HUI to reach 217.38. Those prices were below the USERX and HUI prices from 16-20 trading days earlier. The gold stocks were within one trading day of generating the 16-20 index buy signal that was described in the 7/28/13 SKI Report. Jeff was working on a Buy Update during the evening of 8/07/13 because the 16-20 index buy signal would generate the next day as long as the gold stocks didn’t rise by more than 2.5%. But they exploded higher on that next day (8/08/13) and the “stupid” 16-20 index missed its buy signal at the low by one day. Nonetheless, since the index structure was set up bullishly, the rise did generate the intermediate-term 35-39 index buy signal.
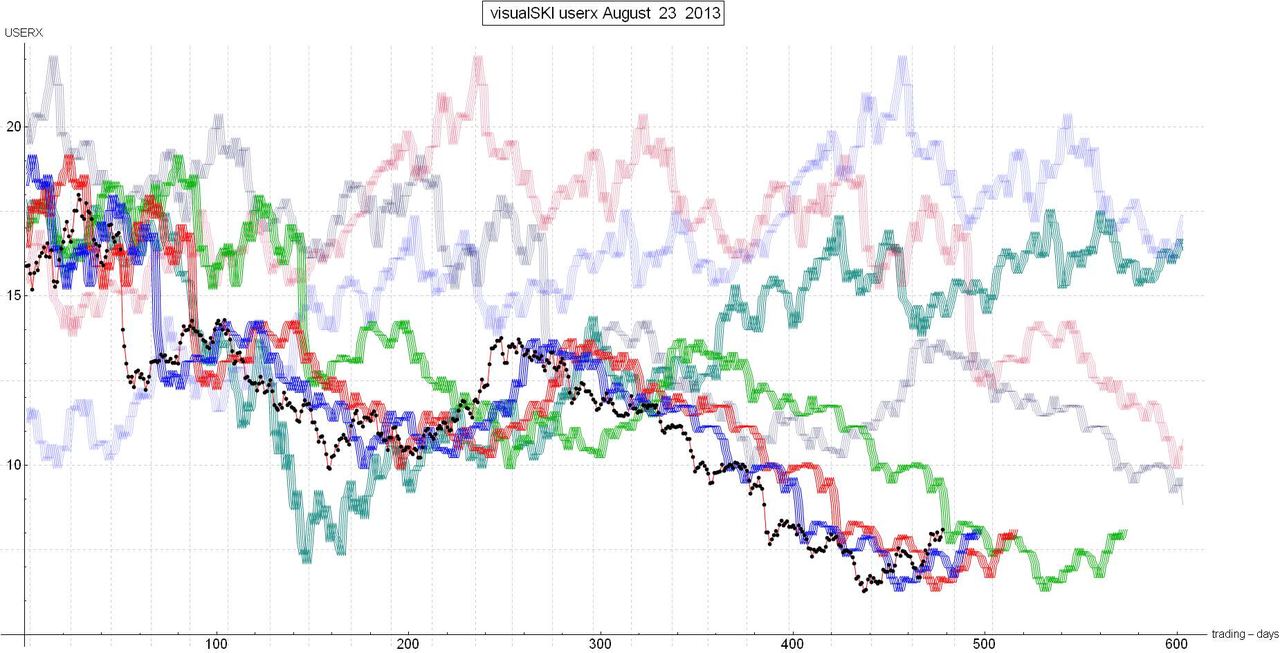
Importantly, this was the first 35-39 index buy signal since 8/17/2012. It has been a whole year since the intermediate-term trending 35-39 index had generated a buy signal. The upside target from such a buy signal is the 92-96 index. Here’s a visual presentation of the SKI indices. The USERX prices are in black, the 16-20 index prices are in blue, the 35-39 index’s prices are in red, and the 92-96 index’s prices are in green. Can you see how the gold stocks declined to just below the blue line at the low, then rose over the red line for the 35-39 index buy signal, and right now are touching the green line? If you go back 92-96 trading days, we are directly on the time and price when gold prices crashed in April 2013. THE GREEN LINE IS MAJOR RESISTANCE.
If you are concerned that “the train has left the station and won’t stop”, that should NOT be the case. A 35-39 index buy signal is NOT a SKI bull market. A SKI bull market requires that the 92-96 index buy signal be On the Path of Trades. That requires that prices rise from a 35-39 index buy signal up to a 92-96 index “buy” signal. Then a decline is needed to sell the 92-96 index. That sell signal opens up the Path of Trades to the next index buy signal. If the market is transitioning into a SKI bull market, the 92-96 index sell signal is then quickly followed by a new 92-96 index buy signal that IS on the Path of Trades. In other words, if a bull market is going to occur, the gold stocks need to now get over that green line (probably this coming week) and then decline back below the green line, and then go back over it. Period. Definitive. These statements cannot be changed.
Conclusion:
The SKI index structure has broken the bearish pattern from the past year via the first 35-39 index buy signal in one year. The upside target, the 92-96 index, is now being reached, and the 92-96 index signal is likely to generate this coming week. The signal is major resistance. The date of the signal is reserved for subscribers.
If prices unexpectedly rise beyond the 92-96 index signal, it will NOT be a bull market and will eventually add to future significant bearish “pain”. No matter what occurs, Jeff (based upon SKI) cannot and will not change that last sentence. If the 92-96 index signal coincides with the next meaningful top (as is expected), the subsequent decline can/may set up the first SKI gold stock bull market in years. That is very possible because the index’s back prices are set-up for that possibility. Having that set-up is rare and that is a major bullish possibility for a month or so from now. But again, we are about to hit major resistance where Jeff will be stating “Sell” because it’s unlikely that anyone “knows” if the next decline will actually provide the final step into a bull market index buy signal until that buy signal actually occurs.
Best Wishes, Jeff
If you are interested in following and learning more about the SKI indices, I'll write another Report in three weeks or you can shell out the big bucks for a SKI subscription. Weekly Updates are available by subscribing for a month (or longer if you're wise and cheap enough to want to save money) at my website www.skigoldstocks.com for the princely sum of $25 (for a one month subscription) or more ($200 for an annual subscription). I also provide more frequent intra-week messages/alerts at a slightly higher price along with access to our informative Forum and a managed gold futures program. The precious metals are in a very long-term (decade+) up-trend but are the most precarious, volatile, and psychologically difficult market in the world (in my opinion). That's the way it's always been.
###
 SKI archives SKI archives
email: jeff@skigoldstocks.com
Jeffrey M. Kern,Ph.D., is an academic psychologist with a specialty in the measurement and prediction of human behavior. The communications provided are for informational purposes only and are not intended to be investment advice or recommendations for specific investment decisions. Dr. Kern is not a registered investment advisor, but is registered as a commodity trading advisor (CTA). The information provided is considered accurate, but cannot be guaranteed. Investments/trading in narrow market segments or gold futures is for individuals willing to accept a higher level of risk for the opportunity of greater returns. Past performance is no guarantee of future performance. His website is www.skigoldstocks.com.
Communications should be sent to: jeff@skigoldstocks.com.
Copyright © 2002-2024 Jeffrey Kern. All Rights Reserved.
321gold Ltd

|
