 Special SKI Report #241 Special SKI Report #241
Gold Stock Timing Update Jeffrey M. Kern, Ph.D.
Email: jeff@skigoldstocks.com
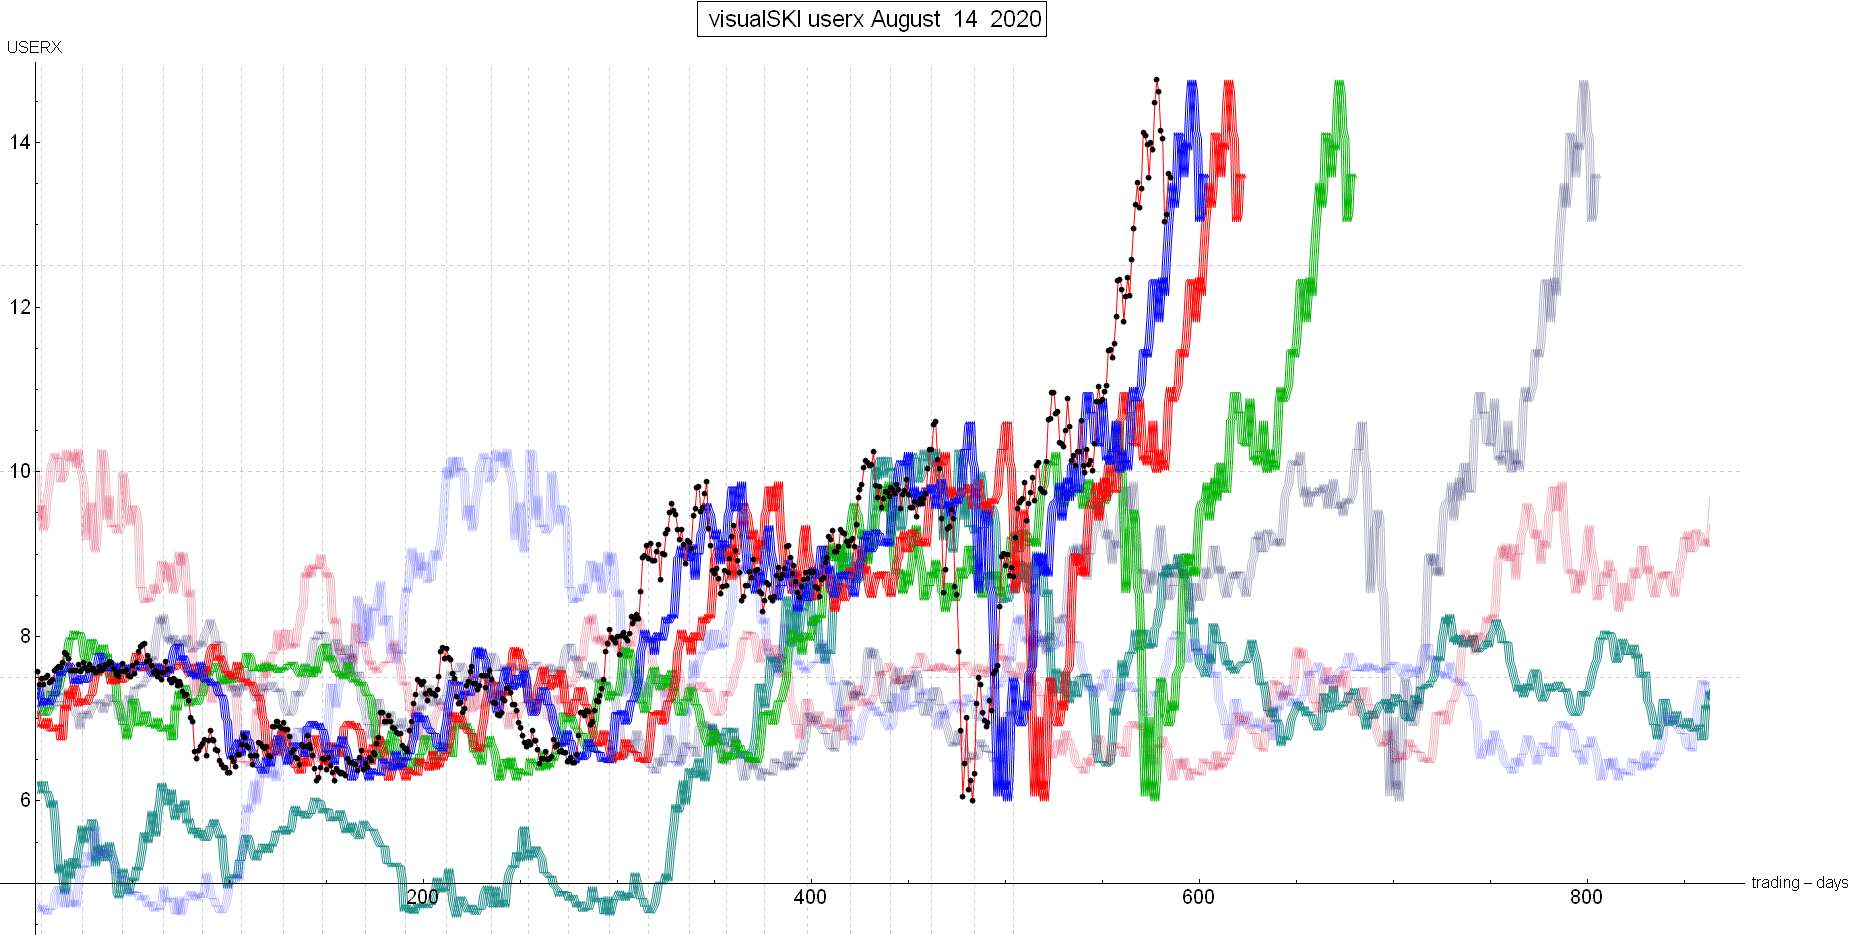
USERX | historicals
Written Sunday Aug 23, 2020
Published Aug 24, 2020 Current USERX price = 13.65, Down only 35 cents (2.5%) since the last report 3 weeks ago. Introduction (repeated from prior Reports):
I have been using my unique SKI indices
to predict price changes in the precious metals' market for more
than two decades. And my indices continue to mark the critical
points. I have initiated a subscription website since 1/13/06
(yes, Friday the 13th) after having posted free updates for years
at www.321gold.com. SKI is a timing service; although
almost everyone seems to believe that market timing is impossible,
that IS what the SKI indices have done for 36 years.
The SKI indices contain short-term (16-20
trading days), intermediate-term (35-39 trading days), and long-term
(92-96 trading days) indices. A more comprehensive description
of these mathematical indices and their history is found here.
Basically, the indices compare today's price to prices from a
specified prior time period. The name of the index specifies the
time period (e.g., 92-96 index = compare today's price to prices
from 96, 95, 94, 93, and 92 trading days earlier). Although I
use the oldest gold mutual fund, USERX, for analyses, the predictions
are applicable to the broad precious metals' market. I do not
recommend or analyze specific stocks, but my subscribers from
around the world regularly discuss individual issues on our Forum.
In addition to the truly unique SKI indices, I also use "run
patterns" to guesstimate turning points in the precious metals'
market. A "run" refers to a pattern of daily up and
down market closing prices. If the market has 3 consecutive days
of higher closing prices, the run is "3 up". If prices
then decline for 2 consecutive days, the run becomes "3 up
and 2 down". If prices then close higher the next day, the
run changes to "2 down and 1 up". Some people have referred
to run patterns as "worms". A run pattern is only completed
after the direction of closing prices has changed. I have compiled
a listing of every run pattern that has ever occurred and generated
probabilities that the end of the run marks a high or a low, moderated
by the indices themselves. New Material The last SKI Report, written on 8/02/20, concluded that “The next multi-week issue is whether last Monday (7/27/20) marked a high at USERX 14.12 to be followed by the several-week (3-4 week) decline into the next ‘SKI-disciplined’ 16-20 index supportive buy signal”. That report also simply concluded that “we ‘know’ with 100% certainty that such a decline will eventually occur. What we do not “know” is WHEN such a decline will occur and that is obviously what matters most over the short-term to intermediate-term. It’s all stretched/overbought, and there’s last Monday’s bearish run pattern, but the primary recommendation continues to be to “ride the bull” and buy yet more when (not “if”) the next corrective decline occurs into a second 16-20 index buy signal”. Jeff can make this a rather brief new Report. After that last Report, the gold stocks manifested a second bearish 1 Down and 2 Up run pattern into 8/05/20 at a new high for gold and for USERX at 14.76. But that was it and the corrective decline began. The harsh 4-day decline into 8/11/20 almost formed a highly bearish Major Top Death Run. That would have completed on 8/12/20 if the gold stocks had declined for a 5th consecutive day on a decline of 10+%. The 4-day decline had already taken USERX down over 11%. But they rose (barely) on 8/12/20 and avoided completing a major topping pattern. That was actually a very important SKI-technical day. The decline hit/touched the 16-20 index support on 8/12/20. As per the Report 3 weeks ago, that did act as support and has been the low-to-date at USERX 13.04-13.13. You can see the 4-day decline to hit the 16-20 index on the following SKI-chart as of that weekend. The black dots are the USERX price. The blue line is the 16-20 index. So USERX fell to hit/touch the index support line, but after that decline, the rebound on the “Buffet-rally news” into last Monday (8/17/20) at USERX 14.29 prevented or delayed an actual 16-20 index buy signal by barely staying above the index line. The 16-20 index is an oversold contrarian index that buys as the gold stocks drop below the index line. Since the March 2020 low and the first corrective decline into a 16-20 index buy signal on 6/12/20-6/15/20, I’ve written that the next SKI-disciplined buy-point would be on the next decline into a USERX 16-20 index buy signal. That index signal is VERY close to generating. A rise that continues to avoid the buy signal should yield an outrageous “super-bull”, but that would be extraordinary. Otherwise, a high-probability buying opportunity is very close. Best Wishes, Jeff If you are interested in following and learning more about the SKI indices, I'll write another Report in three weeks or you can shell out the big bucks for a SKI subscription. Weekly Updates are available by subscribing for a month (or longer if you're wise and cheap enough to want to save money) at my website www.skigoldstocks.com for the princely sum of $30 (for a one month subscription) or more ($240 for an annual subscription). I also provide more frequent intra-week daily messages/alerts at a slightly higher price along with access to our informative Forum. ###  SKI archives SKI archives
email: jeff@skigoldstocks.com
Jeffrey M. Kern,Ph.D., is an academic psychologist with a specialty in the measurement and prediction of human behavior. The communications provided are for informational purposes only and are not intended to be investment advice or recommendations for specific investment decisions. Dr. Kern is not a registered investment advisor, but is registered as a commodity trading advisor (CTA). The information provided is considered accurate, but cannot be guaranteed. Investments/trading in narrow market segments or gold futures is for individuals willing to accept a higher level of risk for the opportunity of greater returns. Past performance is no guarantee of future performance. His website is www.skigoldstocks.com.
Communications should be sent to: jeff@skigoldstocks.com.
Copyright © 2002-2024 Jeffrey Kern. All Rights Reserved. 321gold Ltd

| 