 Special SKI Report #157 Special SKI Report #157
Gold Stock Update Jeffrey M. Kern, Ph.D.
Email: jeff@skigoldstocks.com
USERX | historicals
Written Sunday Aug 9, 2015
Published Aug 10, 2015 Current USERX price = 4.74, Down 31 cents (6%) since the last report 3 weeks ago. Introduction (repeated from prior Reports):
I have been using my unique SKI indices
to predict price changes in the precious metals' market for more
than two decades. And my indices continue to mark the critical
points. I have initiated a subscription website since 1/13/06
(yes, Friday the 13th) after having posted free updates for years
at www.321gold.com. SKI is a timing service; although
almost everyone seems to believe that market timing is impossible,
that IS what the SKI indices have done for 36 years.
The SKI indices contain short-term (16-20
trading days), intermediate-term (35-39 trading days), and long-term
(92-96 trading days) indices. A more comprehensive description
of these mathematical indices and their history is found here.
Basically, the indices compare today's price to prices from a
specified prior time period. The name of the index specifies the
time period (e.g., 92-96 index = compare today's price to prices
from 96, 95, 94, 93, and 92 trading days earlier). Although I
use the oldest gold mutual fund, USERX, for analyses, the predictions
are applicable to the broad precious metals' market. I do not
recommend or analyze specific stocks, but my subscribers from
around the world regularly discuss individual issues on our Forum.
In addition to the truly unique SKI indices, I also use "run
patterns" to guesstimate turning points in the precious metals'
market. A "run" refers to a pattern of daily up and
down market closing prices. If the market has 3 consecutive days
of higher closing prices, the run is "3 up". If prices
then decline for 2 consecutive days, the run becomes "3 up
and 2 down". If prices then close higher the next day, the
run changes to "2 down and 1 up". Some people have referred
to run patterns as "worms". A run pattern is only completed
after the direction of closing prices has changed. I have compiled
a listing of every run pattern that has ever occurred and generated
probabilities that the end of the run marks a high or a low, moderated
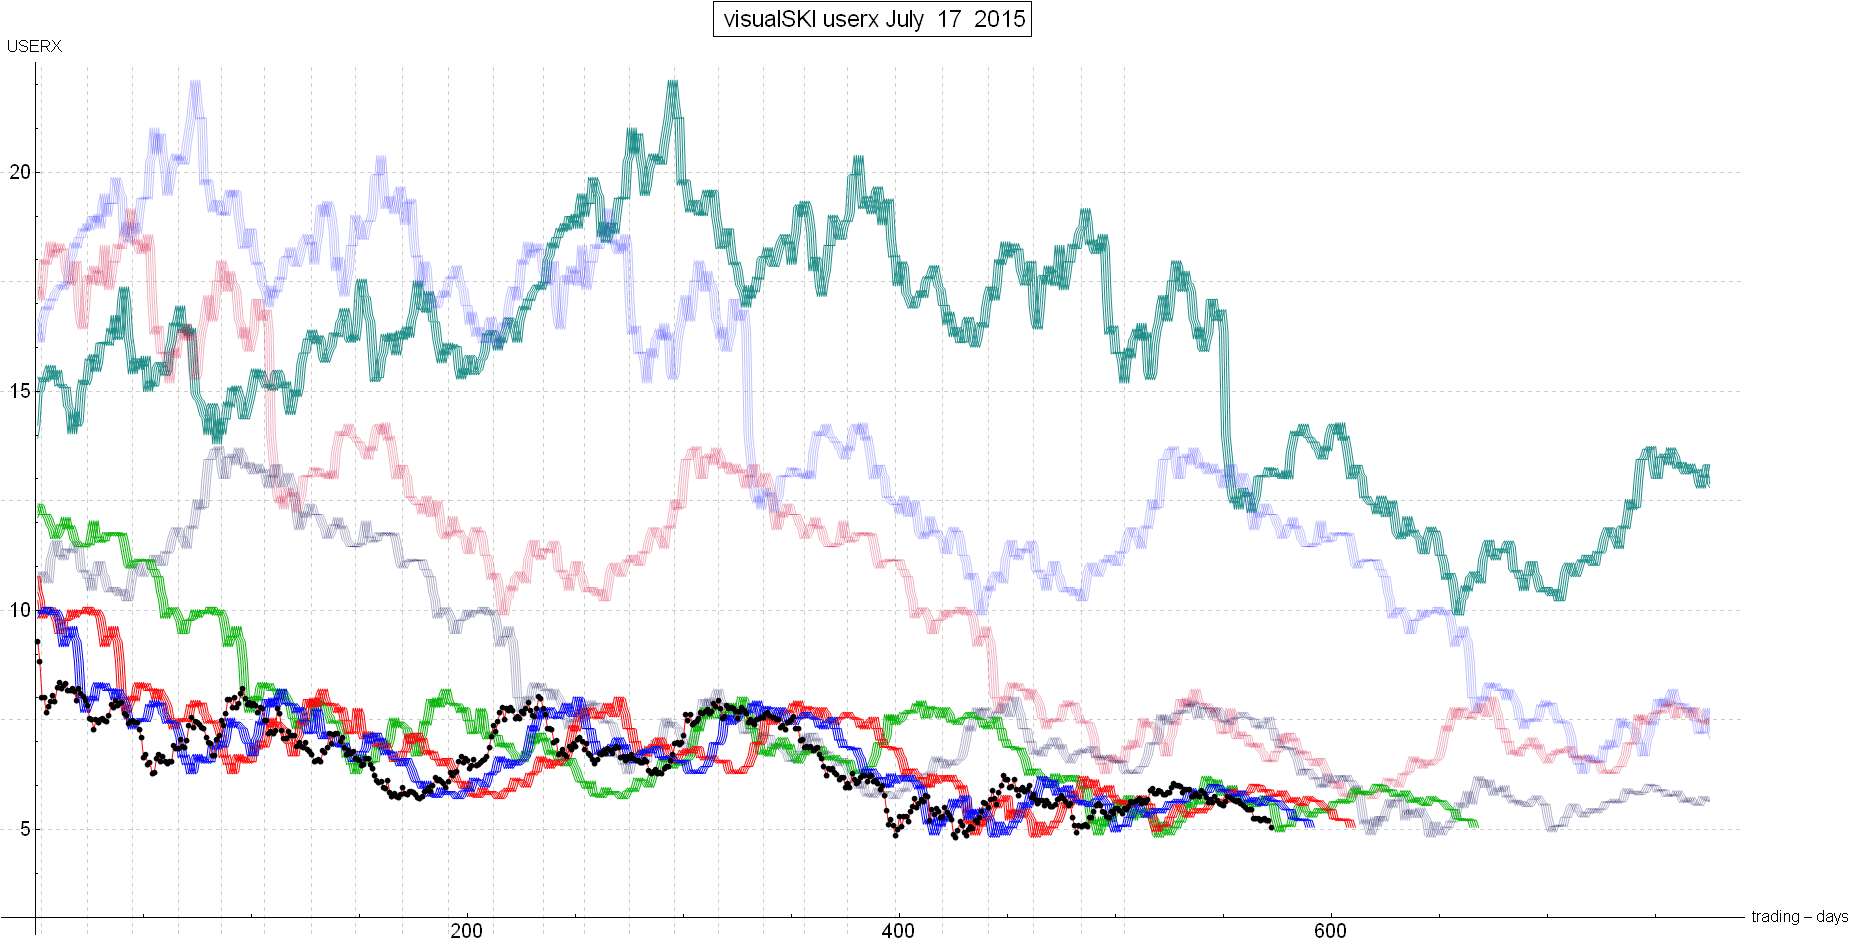
by the indices themselves. New Material The last gold stock SKI Report, written on Sunday 7/19/15, described how the SKI indices had set up for a technically/psychologically critical period that began on 7/17/15: The USERX 92-96 index USERX was declining to a bottom on the next trading as depicted in the courtesy SKI chart provided in that report; the 92-96 index is the green line). If USERX could have risen just a few pennies over the next few days to get above that declining green line, the 92-96 index would have generated a buy signal with a rising sell-stop. But the simplest path was to avoid such a buy signal in a continuing bearish manner. About 8 hours after that SKI Report was written, gold dropped $52 in one minute. Analysts attributed that plunge to various factors: Chinese dumping of gold after China reported smaller-than-expected gold purchases during the past several years, manipulation of the market, etc… Frankly, although I would not state that SKI “predicted” that plunge, the plunge was not surprising as it occurred on exactly the right day to continue to avoid a potentially bullish 92-96 index buy signal. The HUI, GDX, the XAU, and gold had already made new multi-year lows and the USERX 92-96 index had just entered the important technical time period. That plunge finally brought USERX (and GDXJ) to new multi-year lows as the sell stops were triggered. And frankly, as that 7/20/15 plunge occurred, Jeff could not make any short-term predictions: USERX had plunged to well below all of the SKI indices. Therefore, the trend was continuing bearish, but there wasn’t any immediate technical “need” for a continuing decline.
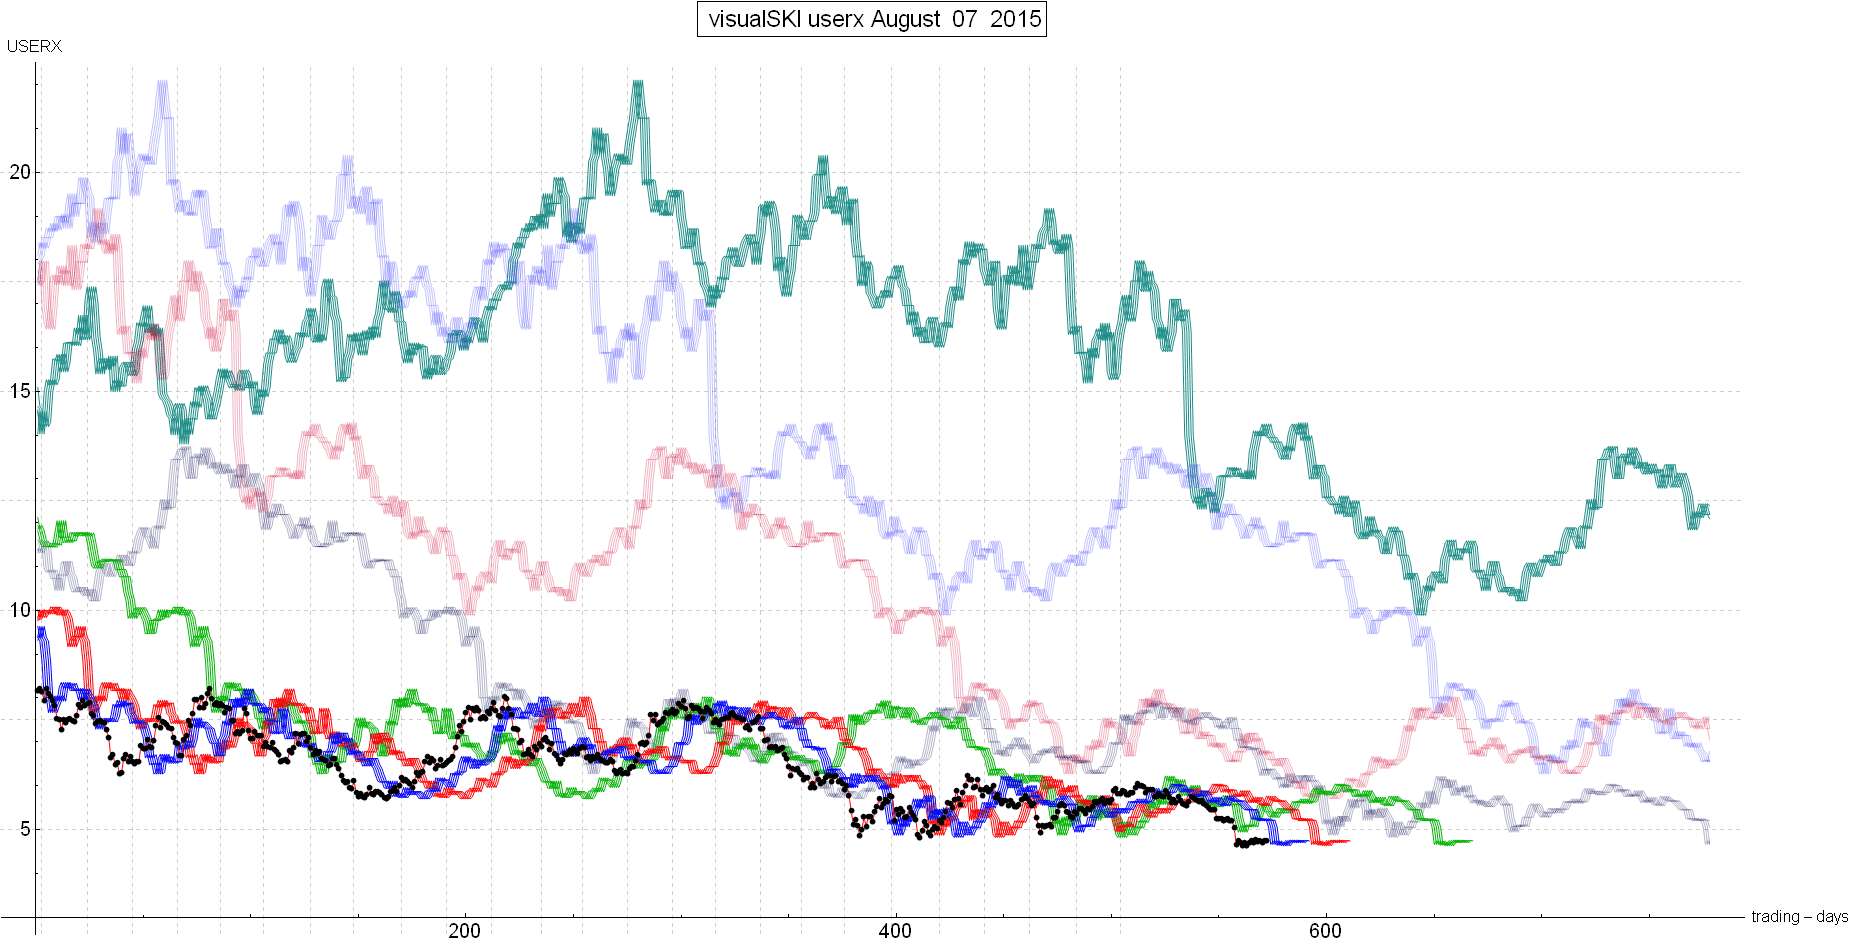
You should always pay attention to the daily ups and downs that form a run pattern. For example, USERX provided a classically bullish 2 days Up and 5 days Down run pattern into the 12/16/2014 16-20 index buy signal that marked an exact multi-month low at USERX 4.82. And on the 7/20/15 plunge, the HUI manifested a 2 Up and 10 Down run pattern that completed a 25%! decline over those 10 trading days. Such a run, if/when it occurs for USERX should/will mark a final bear market low. But, unfortunately for the bulls, that run pattern only occurred for the HUI. USERX is the important dependent measure and USERX did not manifest that Life Run low pattern. The market has now used up 15 trading days since the last SKI Report. USERX has gone sideways since that 7/20/15 plunge to 4.66. The SKI indices are aligned in the normal bear market manner: The 16-20 index is the lowest index, the 35-39 index is above it, and the 92-96 index is the highest of the three primary indices. During a bear market, the gold stocks would need to RISE over the 16-20 index to provide any bullish possibilities. Now that 15 trading days have been used up (in a rather perfect technical/psychological manner), THE NEXT MEANINGFUL TECHNICAL PERIOD IS CLOSE AT HAND. The 16-20 index resistance will be hit/touched in XX trading days. Any bullish case requires a rise over that 16-20 index. Such a rise could occur over the next XX trading days, but until such a rise occurs, the bearish trend remains intact. I’m sorry that those XXs are reserved for subscribers, but I can report that those XXs are single-digit numbers and here’s another complimentary chart of the SKI indices. The 16-20 index is the blue line and note the similarity to where the gold stocks (USERX) were at the last Report, but now it’s the blue line instead of the green line. The bulls absolutely require a rise to over that blue line, and soon… Hoping that these public 321gold SKI Reports are useful for you. Best Wishes, Jeff If you are interested in following and learning more about the SKI indices, I'll write another Report in three weeks or you can shell out the big bucks for a SKI subscription. Weekly Updates are available by subscribing for a month (or longer if you're wise and cheap enough to want to save money) at my website www.skigoldstocks.com for the princely sum of $25 (for a one month subscription) or more ($200 for an annual subscription). I also provide more frequent intra-week messages/alerts at a slightly higher price along with access to our informative Forum and a managed gold futures program. The precious metals are in a very long-term (decade+) up-trend but are the most precarious, volatile, and psychologically difficult market in the world (in my opinion). That's the way it's always been. ###  SKI archives SKI archives
email: jeff@skigoldstocks.com
Jeffrey M. Kern,Ph.D., is an academic psychologist with a specialty in the measurement and prediction of human behavior. The communications provided are for informational purposes only and are not intended to be investment advice or recommendations for specific investment decisions. Dr. Kern is not a registered investment advisor, but is registered as a commodity trading advisor (CTA). The information provided is considered accurate, but cannot be guaranteed. Investments/trading in narrow market segments or gold futures is for individuals willing to accept a higher level of risk for the opportunity of greater returns. Past performance is no guarantee of future performance. His website is www.skigoldstocks.com.
Communications should be sent to: jeff@skigoldstocks.com.
Copyright © 2002-2024 Jeffrey Kern. All Rights Reserved. 321gold Ltd

|
