 Special SKI Report #173 Special SKI Report #173
Gold Stock Update: Still Hanging Onto Bullishness Jeffrey M. Kern, Ph.D.
Email: jeff@skigoldstocks.com
USERX | historicals
Written Sunday Jul 31, 2016
Published Aug 1, 2016 Current USERX price = 10.07, Down 7 cents (.7%) since the last report 3 weeks ago. Introduction (repeated from prior Reports):
I have been using my unique SKI indices
to predict price changes in the precious metals' market for more
than two decades. And my indices continue to mark the critical
points. I have initiated a subscription website since 1/13/06
(yes, Friday the 13th) after having posted free updates for years
at www.321gold.com. SKI is a timing service; although
almost everyone seems to believe that market timing is impossible,
that IS what the SKI indices have done for 36 years.
The SKI indices contain short-term (16-20
trading days), intermediate-term (35-39 trading days), and long-term
(92-96 trading days) indices. A more comprehensive description
of these mathematical indices and their history is found here.
Basically, the indices compare today's price to prices from a
specified prior time period. The name of the index specifies the
time period (e.g., 92-96 index = compare today's price to prices
from 96, 95, 94, 93, and 92 trading days earlier). Although I
use the oldest gold mutual fund, USERX, for analyses, the predictions
are applicable to the broad precious metals' market. I do not
recommend or analyze specific stocks, but my subscribers from
around the world regularly discuss individual issues on our Forum.
In addition to the truly unique SKI indices, I also use "run
patterns" to guesstimate turning points in the precious metals'
market. A "run" refers to a pattern of daily up and
down market closing prices. If the market has 3 consecutive days
of higher closing prices, the run is "3 up". If prices
then decline for 2 consecutive days, the run becomes "3 up
and 2 down". If prices then close higher the next day, the
run changes to "2 down and 1 up". Some people have referred
to run patterns as "worms". A run pattern is only completed
after the direction of closing prices has changed. I have compiled
a listing of every run pattern that has ever occurred and generated
probabilities that the end of the run marks a high or a low, moderated
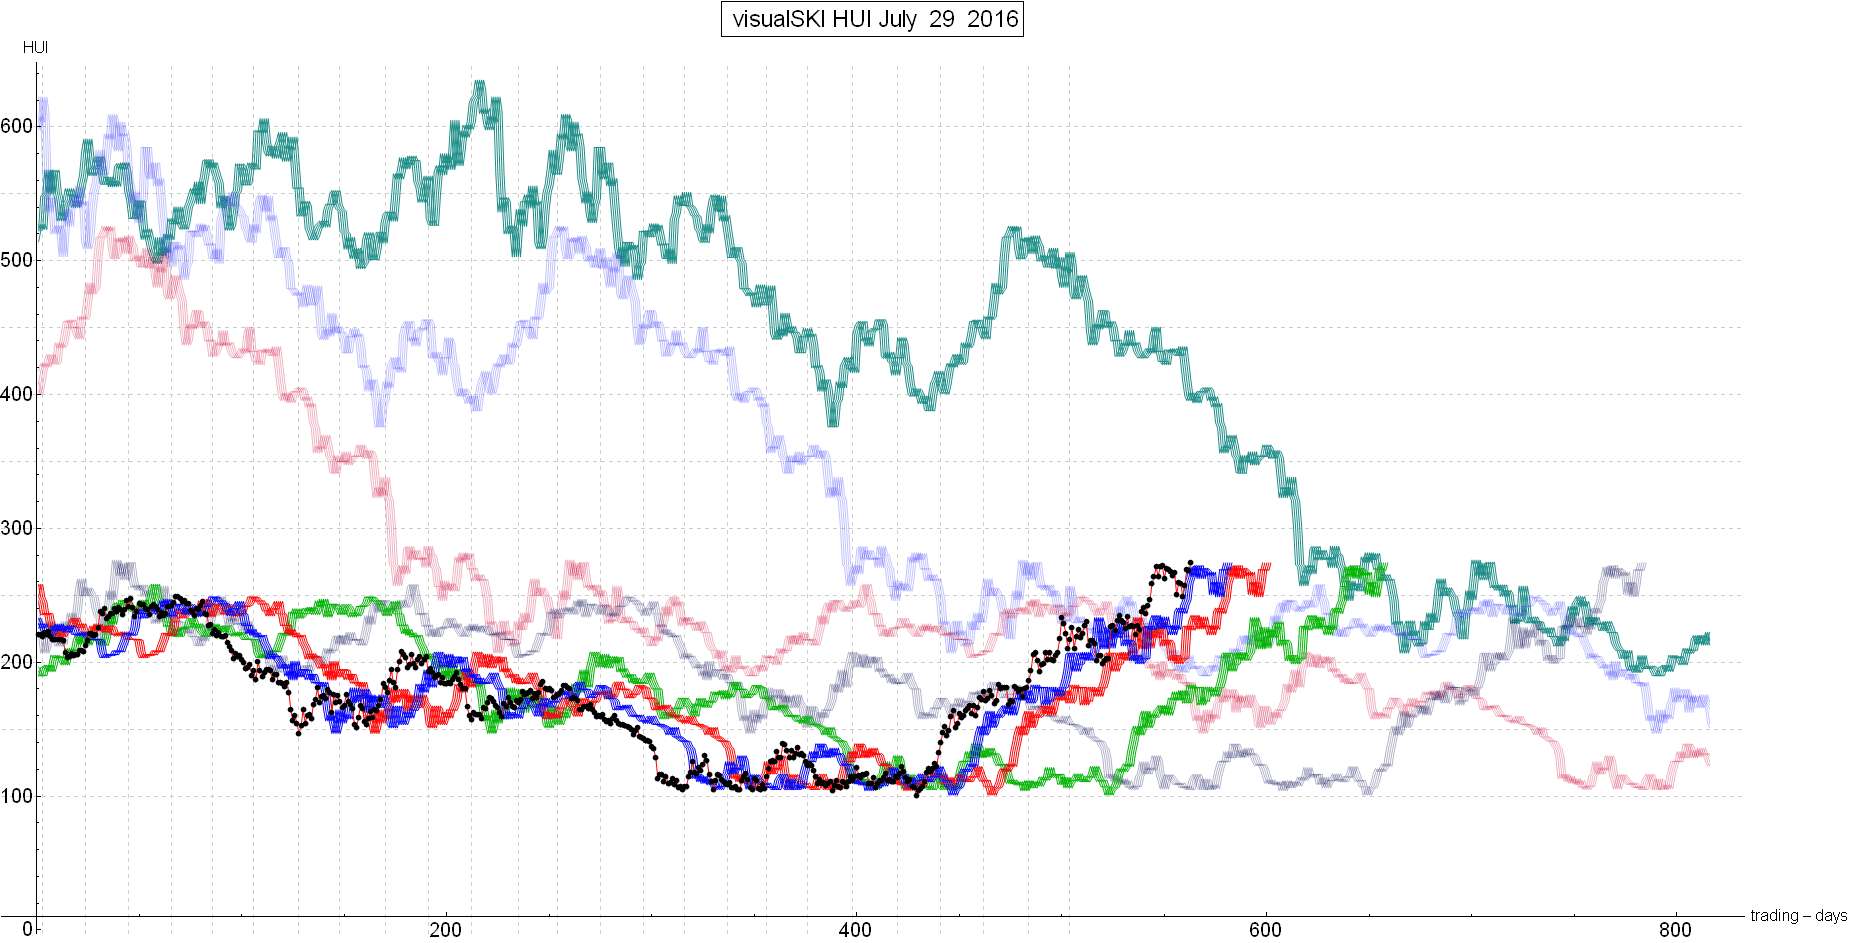
by the indices themselves. New Material The last SKI Report, written on Sunday 7/10/16, concluded that: (1) The bull was continuing, (2) There wasn’t any new prediction unless the new sell-stop was activated during the next 2-3 weeks due to an unexpectedly harsh decline, and (3) In 2-3 weeks, the 16-20 index would be rising to current price levels and we’d see what was happening at that time. That last SKI Report was written one day before a high occurred (in hindsight). Shortly after it was written, USERX completed a generally bearish 1 Down and 2 Up run pattern when USERX rose on 7/11/16 to 10.18 and then declined the next day. Such run patterns are not particularly useful during bull markets, but then USERX completed a second consecutive 1 Down and 2 Up run pattern into 7/14/16 at 10.18 again. It was essentially a short-term double top, and the two consecutive 1 Down and 2 Up run patterns had an 80% historical probability of marking a short-term, intermediate-term, or long-term top (i.e., “some type of top” even during bull markets). If USERX had plunged for 5+ consecutive trading days after that second run pattern top on 7/14/16, it would have been an unexpected long-term top, but that did not occur. Therefore, that 10.18 high was either just a short-term top or a major intermediate-term top. All of the SKI bull markets since 1974 (when the mutual fund USERX was formed) have made significant highs after a “melt-up” phase began. The “melt-up” phase is objectively defined as beginning when a correction is shallow and only goes down to a 16-20 index buy signal (as opposed to stronger correction that goes down to a 16-20 index buy signal AND then continues down to the 35-39 index). During the current bull market, the first correction only went to the 16-20 index buy signal on 4/04/16 at USERX 6.47. That index buy signal marked the exact low and initiated the “melt-up” phase. During “melt-up” phases, there’s never been more than two such 16-20 index buy signals that have been valid (i.e., the third one has not marked a low and its occurrence has been bearish). During the current bull market, we got the second 16-20 index buy signal at the exact low on 5/27/16 at USERX 7.67. Therefore, a third decline to such a buy signal would be bearish based upon the history of prior bull markets. There aren’t any “guarantees” that such a history will continue, but that’s the best information available (in my opinion) because it’s difficult to identify a major intermediate-term high during a bull market. The decline from the 7/11/16 and 7/14/16 tops at USERX 10.18 went right down near the 16-20 index. On this past Monday (7/25/16), USERX closed at 9.28. That was just above the 16-20 index and USERX NEEDED TO RISE IMMEDIATELY TO AVOID GENERATING THAT THIRD (unwanted) 16-20 INDEX SIGNAL. USERX needed to rise above 9.35 on last Tuesday (7/26/16) to stay above all five of the 16-20 index’s back prices. It rose to 9.38. On the next trading day (7/27/16; the U.S. Federal Reserve announcement day), the 16-20 index’s back prices were rising to include a 9.73. Therefore, the gold stocks needed to really start rising to avoid the 16-20 index’s unwanted buy signal. USERX rose strongly to 9.69, but didn’t quite stay ahead of that rising 16-20 index: The gold stocks needed to keep rising immediately to avoid that unwanted index signal. Last Thursday, that index’s back prices were rising to include 9.03, 9.17, 9.35, 9.73, and 10.06. Although the HUI/GDX declined a little on Thursday, USERX kept rising to 9.81. It therefore went over the 9.73 price, but still was below the 10.06. The 16-20 index did not generate the unwanted buy signal, but the gold stocks still needed a further rise more to stay over the index’s continually rising back prices. Friday’s (7/29/16) rise to 10.07 did the trick by rising 1-penny above all five of the index’s back prices. Conclusion After two consecutive 16-20 index buy signals that marked exact corrective lows, the validity of the index was once again supported by last week’s rise that just barely stayed above that index for continued potential bullishness. But that index’s back prices will continue to rise to USERX 10.18 shortly, so the bullishness could end if the rise does not continue and the 16-20 index generates its “unwanted” buy signal (see above). Three weeks ago, I wrote how there wasn’t an immediate “need” to subscribe. But now, if the gold stocks do not keep rising to stay ahead of the 16-20 index, history will strongly suggest that a major intermediate-term top has occurred (probably not as of this past Friday, but soon). Note that this is NOT a prediction until the index signal actually generates and it very well may not generate. We’ll see during the next 1-2 weeks. If the index signal is avoided again (as happened last week), the bullishness should continue over time. If not, the major intermediate-term correction should have begun. Take a look at the SKI USERX chart to see how USERX rose exactly as needed last week to stay above that rising blue 16-20 index line and the same for the HUI. Rather exact again, no? Best Wishes, Jeff If you are interested in following and learning more about the SKI indices, I'll write another Report in three weeks or you can shell out the big bucks for a SKI subscription. Weekly Updates are available by subscribing for a month (or longer if you're wise and cheap enough to want to save money) at my website www.skigoldstocks.com for the princely sum of $25 (for a one month subscription) or more ($200 for an annual subscription). I also provide more frequent intra-week messages/alerts at a slightly higher price along with access to our informative Forum and a managed gold futures program. The precious metals are in a very long-term (decade+) up-trend but are the most precarious, volatile, and psychologically difficult market in the world (in my opinion). That's the way it's always been. ###  SKI archives SKI archives
email: jeff@skigoldstocks.com
Jeffrey M. Kern,Ph.D., is an academic psychologist with a specialty in the measurement and prediction of human behavior. The communications provided are for informational purposes only and are not intended to be investment advice or recommendations for specific investment decisions. Dr. Kern is not a registered investment advisor, but is registered as a commodity trading advisor (CTA). The information provided is considered accurate, but cannot be guaranteed. Investments/trading in narrow market segments or gold futures is for individuals willing to accept a higher level of risk for the opportunity of greater returns. Past performance is no guarantee of future performance. His website is www.skigoldstocks.com.
Communications should be sent to: jeff@skigoldstocks.com.
Copyright © 2002-2024 Jeffrey Kern. All Rights Reserved. 321gold Ltd

|
