 Special SKI Report #222 Special SKI Report #222
What the SKI-Bull Needs to Remain Intact Jeffrey M. Kern, Ph.D.
Email: jeff@skigoldstocks.com
USERX | historicals
Written Sunday Jul 7, 2019
Published Jul 8, 2019 Current USERX price = 7.99, Up another 78 cents (10.8%) since the last report 3 weeks ago. Introduction (repeated from prior Reports):
I have been using my unique SKI indices
to predict price changes in the precious metals' market for more
than two decades. And my indices continue to mark the critical
points. I have initiated a subscription website since 1/13/06
(yes, Friday the 13th) after having posted free updates for years
at www.321gold.com. SKI is a timing service; although
almost everyone seems to believe that market timing is impossible,
that IS what the SKI indices have done for 36 years.
The SKI indices contain short-term (16-20
trading days), intermediate-term (35-39 trading days), and long-term
(92-96 trading days) indices. A more comprehensive description
of these mathematical indices and their history is found here.
Basically, the indices compare today's price to prices from a
specified prior time period. The name of the index specifies the
time period (e.g., 92-96 index = compare today's price to prices
from 96, 95, 94, 93, and 92 trading days earlier). Although I
use the oldest gold mutual fund, USERX, for analyses, the predictions
are applicable to the broad precious metals' market. I do not
recommend or analyze specific stocks, but my subscribers from
around the world regularly discuss individual issues on our Forum.
In addition to the truly unique SKI indices, I also use "run
patterns" to guesstimate turning points in the precious metals'
market. A "run" refers to a pattern of daily up and
down market closing prices. If the market has 3 consecutive days
of higher closing prices, the run is "3 up". If prices
then decline for 2 consecutive days, the run becomes "3 up
and 2 down". If prices then close higher the next day, the
run changes to "2 down and 1 up". Some people have referred
to run patterns as "worms". A run pattern is only completed
after the direction of closing prices has changed. I have compiled
a listing of every run pattern that has ever occurred and generated
probabilities that the end of the run marks a high or a low, moderated
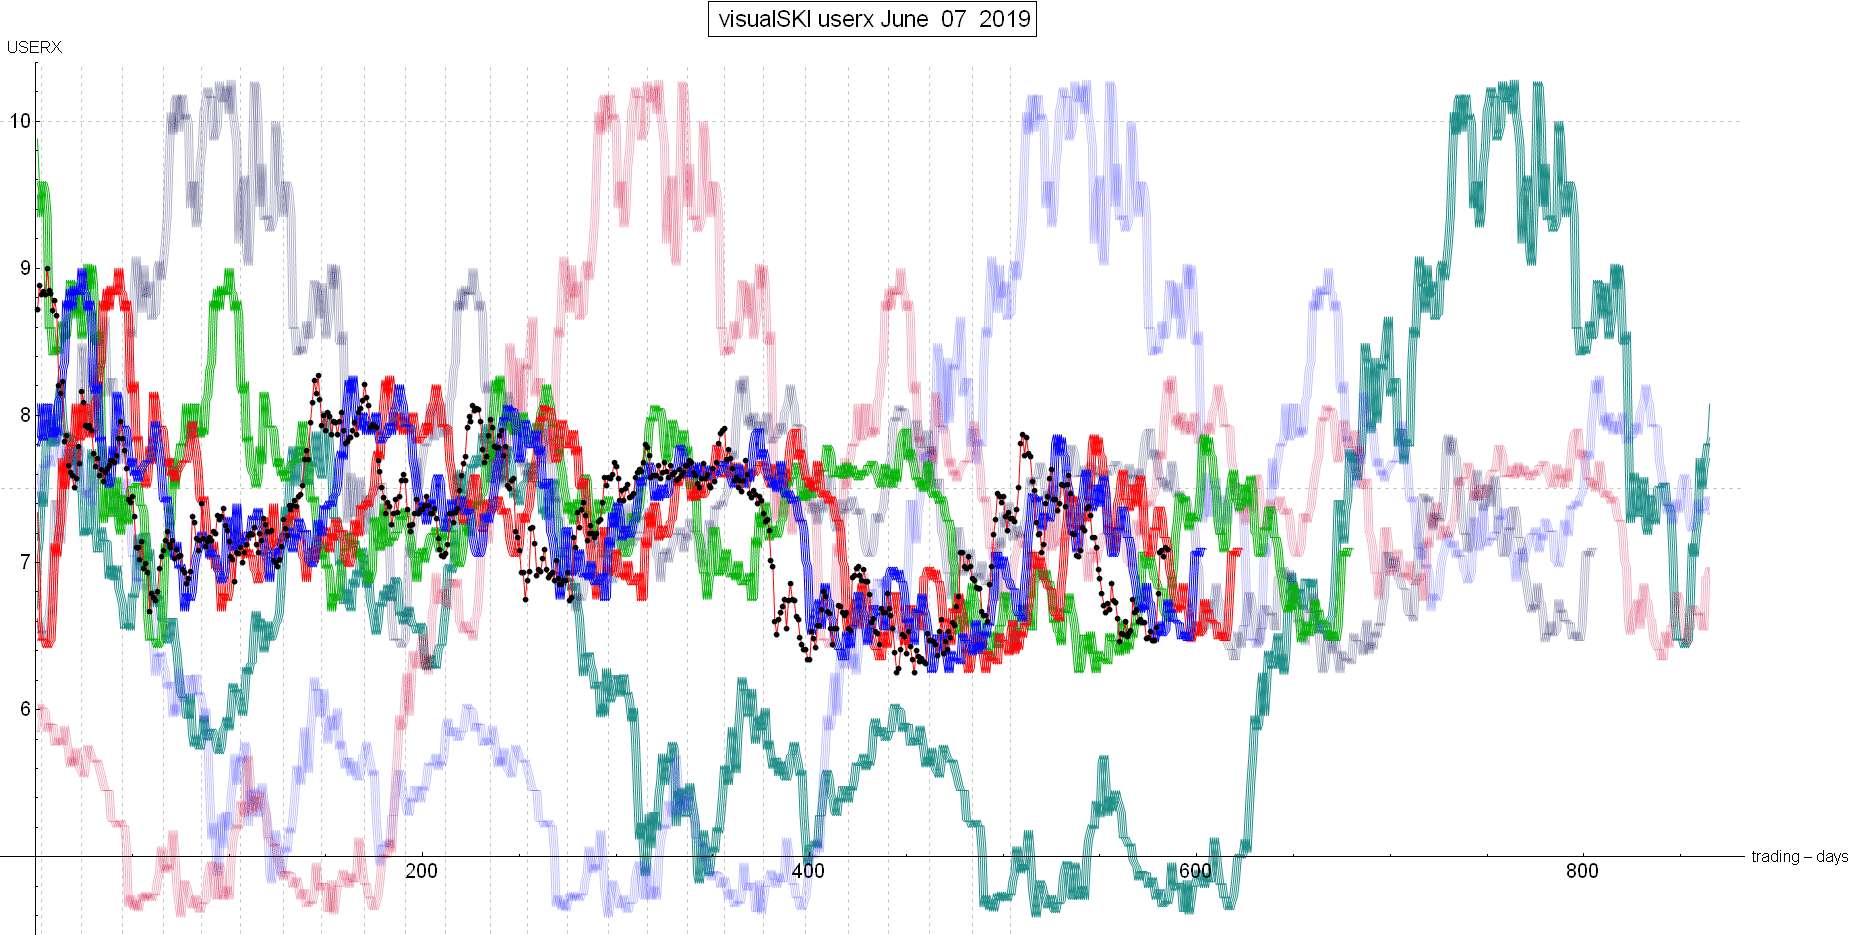
by the indices themselves. New Material The last SKI Report (written on Sunday, June 16, 2019) provided a linkto a 6/12/19 interview that described how SKI had generated its potential bull market buy signal by going over the 92-96 index (the prices from 92-96 trading days earlier). Such bull markets target a 6-12 month 100+% rise. In order to maintain that bull market, USERX needed to keep rising to stay above that index which was depicted as the green line in the linked chart where the back dots represent the USERX daily closing price. USERX was going to need to rise to over 7.40 by the 6/19/19 U.S. Federal Reserve announcement and then keep rising to a new 2019 high (above the 2/20/19 high of 7.87. You need to understand that a simple rise to over the green line 92-96 index usually is NOT a bull market and one is often supposed to sell of go short when USERX generates a 92-96 index “buy” signal to mark a high. The criteria for a bull market has stayed the same since the indices were discovered in 1985: USERX MUST rise over the 92-96 index BEFORE rising over the red line 35-39 index. It did so in late January 2016 for that bull market. It also did that in the Summer of 2018 but then failed and yielded the strong decline to the low in the Fall of 2018. Here’s the current SKI chart. You should be able to see that USERX is above the 92-96 index’s green line. On last Monday (7/01/19; 4 trading days ago), the gold stocks and gold declined significantly. Whereas GDX dropped almost 4%, USERX’s decline was less extreme because Monday “just happened to be” a Canadian market holiday and 60% of USERX’s holdings are in Canada. Therefore, they were unchanged for that day and USERX dropped to 7.78. Nonetheless, Monday’s decline still hit/touched the 92-96 index, moving it a little towards a sell signal just as the index’s back prices rose to include a new high price of 7.81. The problem for maintaining the bull market was that when the Canadian market reopened on Tuesday (7/02/19), USERX’s Canadian holdings were likely to drop 3-4% and a continued decline would make it highly likely that the 92-96 index would soon generate its sell signal. Those gold stocks did drop 3% on the open, but then the entire complex was “saved” by a rise throughout the day. The 92-96 index sell signal was avoided and the bull market was maintained. It’s not unusual for the indices to be exact in relationship to the market/nature. Now, RIGHT NOW, you should be able to see that the index’s green line is finally peaking at that 2/20/19 high of USERX 7.87 while USERX is at 7.99. The exact 92-96 index’s back prices for this coming week are: | Monday (7/08/19): | 7.81, 7.87, 7.73, 7.85, 7.74 | | Tuesday (7/09/19): | 7.87, 7.73, 7.85, 7.74, 7.72 | | Wednesday (7/10/19): | 7.73, 7.85, 7.74, 7.72, 7.55 | | Thursday (7/11/19): | 7.85, 7.74, 7.72, 7.55, 7.49 | | Friday (7/12/19): | 7.74, 7.72, 7.55, 7.49, 7.27 | Bears have this final historical chance during the first few days of this coming week to sell the gold stocks down below USERX 7.73 to generate a “failure” 92-96 index sell signal. Historically, if the bull market persists past this point in time, it is extremely likely to continue for the expected 6-12+ months. Jeff is not expecting the sell signal to generate, BUT NOTE THAT THE GOLD STOCKS CAN STILL DECLINE NOW WITHOUT SELLING THE BULL MARKET 92-96 INDEX. In fact, all but one of these types of SKI bull markets since 1974 have shown a DECLINE shortly AFTER the start of the bull market. And the larger the decline (without selling the 92-96 index), the larger the subsequent bull market rise. The correlation between the size of the initial decline and the size of the subsequent rise is .86 (statistically significant at p<.05). For example, the largest decline of 7% yielded the largest bull market (500+%) in 1979. There’s more information that is too much for this 321gold Report. The SKI long-term indices (from 221, 442, and 663 trading days earlier) have also gone to a bull market, but the market has just generated the 663 index’s contrarian sell signal. It’s the long-term equivalent of the regular 16-20 index because it buys on declines and sells on rises. How one invests/trades this young bull market is a function of one’s own personal risk tolerance and time frame. The simplest approach is to just remain long unless the 92-96 index sells. But SKI is usually excellent at marking corrective lows during bull markets (and marking highs during bear markets). For example, during the 2016 bull market, the gold stocks’ 5-Wave rise included the Wave 2 and Wave 4 declines to supportive 16-20 index buy signals that executed on the exact corrective lows. IF THE HISTORICALLY-LIKELY DECLINE IS ABOUT TO OCCUR, A DECLINE TO BELOW THE PRICES FROM 16-20 TRADING DAYS EARLIER IS SUPPOSED TO MARK THE NEXT LOW (without selling the 92-96 index) in a few weeks. Again, the 16-20 index is a contrarian index that generates buy signals on declines and generates sell signals on rises. Best Wishes, Jeff If you are interested in following and learning more about the SKI indices, I'll write another Report in three weeks or you can shell out the big bucks for a SKI subscription. Weekly Updates are available by subscribing for a month (or longer if you're wise and cheap enough to want to save money) at my website www.skigoldstocks.com for the princely sum of $30 (for a one month subscription) or more ($240 for an annual subscription). I also provide more frequent intra-week daily messages/alerts at a slightly higher price along with access to our informative Forum. ###  SKI archives SKI archives
email: jeff@skigoldstocks.com
Jeffrey M. Kern,Ph.D., is an academic psychologist with a specialty in the measurement and prediction of human behavior. The communications provided are for informational purposes only and are not intended to be investment advice or recommendations for specific investment decisions. Dr. Kern is not a registered investment advisor, but is registered as a commodity trading advisor (CTA). The information provided is considered accurate, but cannot be guaranteed. Investments/trading in narrow market segments or gold futures is for individuals willing to accept a higher level of risk for the opportunity of greater returns. Past performance is no guarantee of future performance. His website is www.skigoldstocks.com.
Communications should be sent to: jeff@skigoldstocks.com.
Copyright © 2002-2024 Jeffrey Kern. All Rights Reserved. 321gold Ltd

|
