 Special SKI Report #204 Special SKI Report #204
Gold Stock Update: SKI-Technical Point Coming THIS Week Jeffrey M. Kern, Ph.D.
Email: jeff@skigoldstocks.com
USERX | historicals
Written Sunday Jun 10, 2018
Published Jun 11, 2018 Current USERX price = 7.61, Up 4 cents (0.5%) since the last report 3 weeks ago. Introduction (repeated from prior Reports):
I have been using my unique SKI indices
to predict price changes in the precious metals' market for more
than two decades. And my indices continue to mark the critical
points. I have initiated a subscription website since 1/13/06
(yes, Friday the 13th) after having posted free updates for years
at www.321gold.com. SKI is a timing service; although
almost everyone seems to believe that market timing is impossible,
that IS what the SKI indices have done for 36 years.
The SKI indices contain short-term (16-20
trading days), intermediate-term (35-39 trading days), and long-term
(92-96 trading days) indices. A more comprehensive description
of these mathematical indices and their history is found here.
Basically, the indices compare today's price to prices from a
specified prior time period. The name of the index specifies the
time period (e.g., 92-96 index = compare today's price to prices
from 96, 95, 94, 93, and 92 trading days earlier). Although I
use the oldest gold mutual fund, USERX, for analyses, the predictions
are applicable to the broad precious metals' market. I do not
recommend or analyze specific stocks, but my subscribers from
around the world regularly discuss individual issues on our Forum.
In addition to the truly unique SKI indices, I also use "run
patterns" to guesstimate turning points in the precious metals'
market. A "run" refers to a pattern of daily up and
down market closing prices. If the market has 3 consecutive days
of higher closing prices, the run is "3 up". If prices
then decline for 2 consecutive days, the run becomes "3 up
and 2 down". If prices then close higher the next day, the
run changes to "2 down and 1 up". Some people have referred
to run patterns as "worms". A run pattern is only completed
after the direction of closing prices has changed. I have compiled
a listing of every run pattern that has ever occurred and generated
probabilities that the end of the run marks a high or a low, moderated
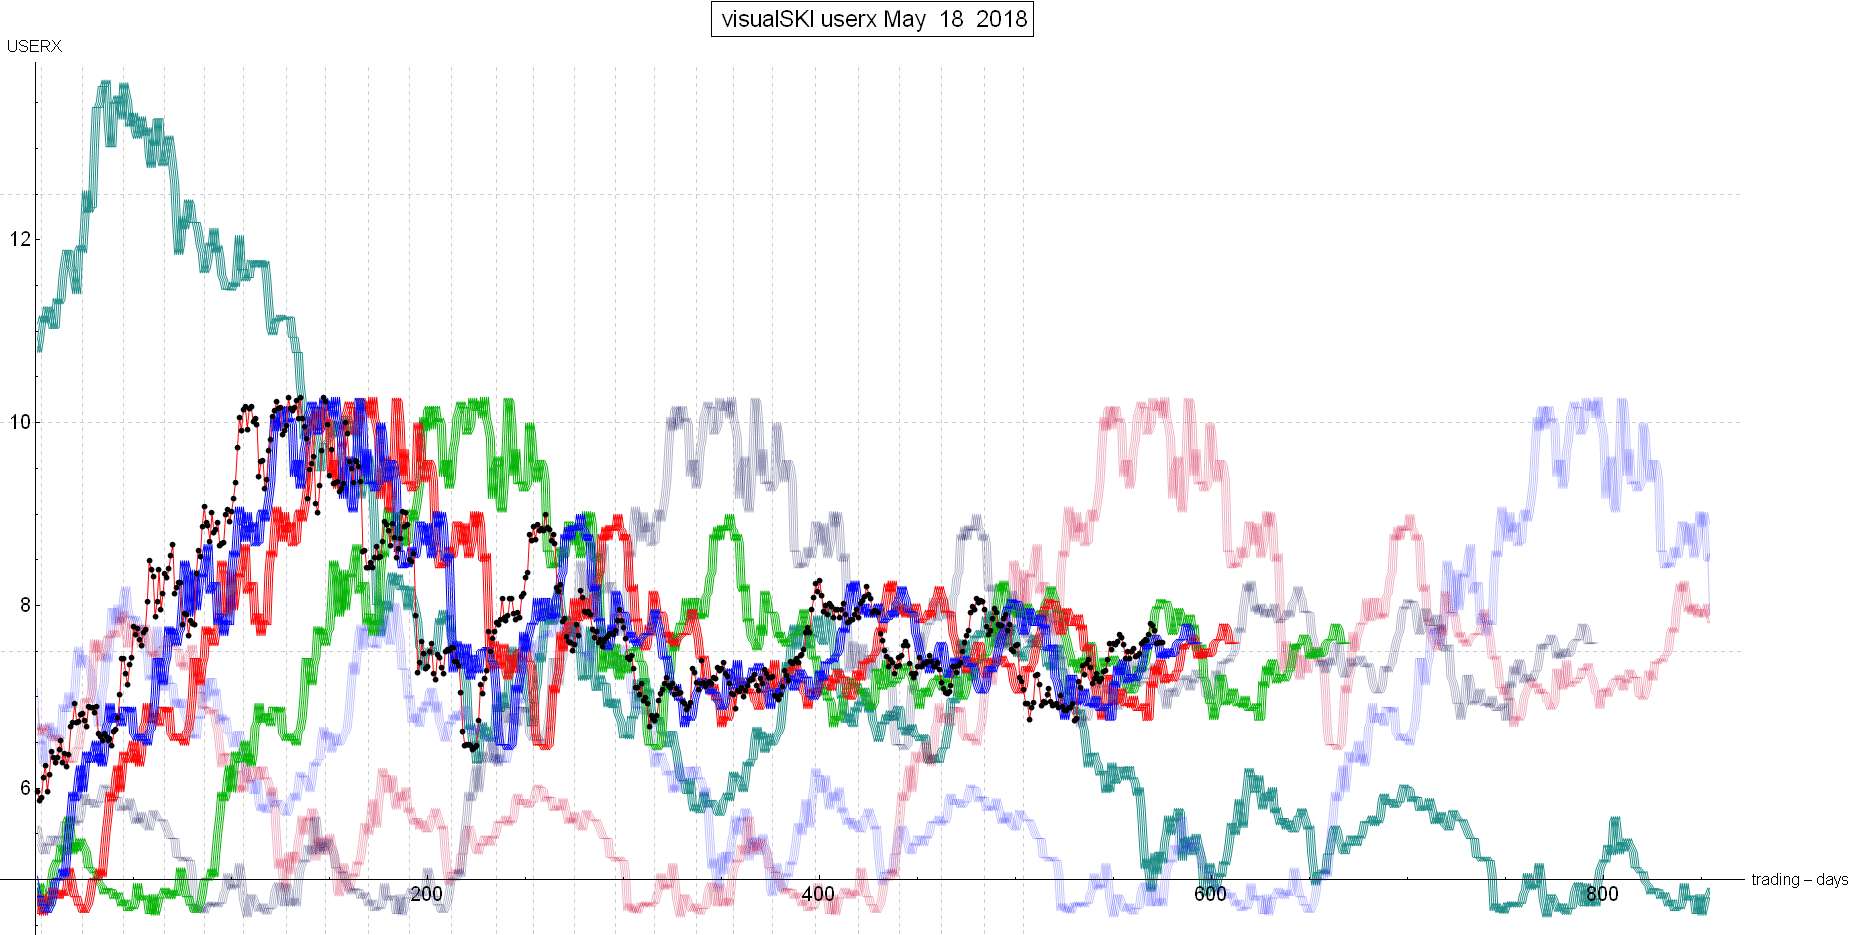
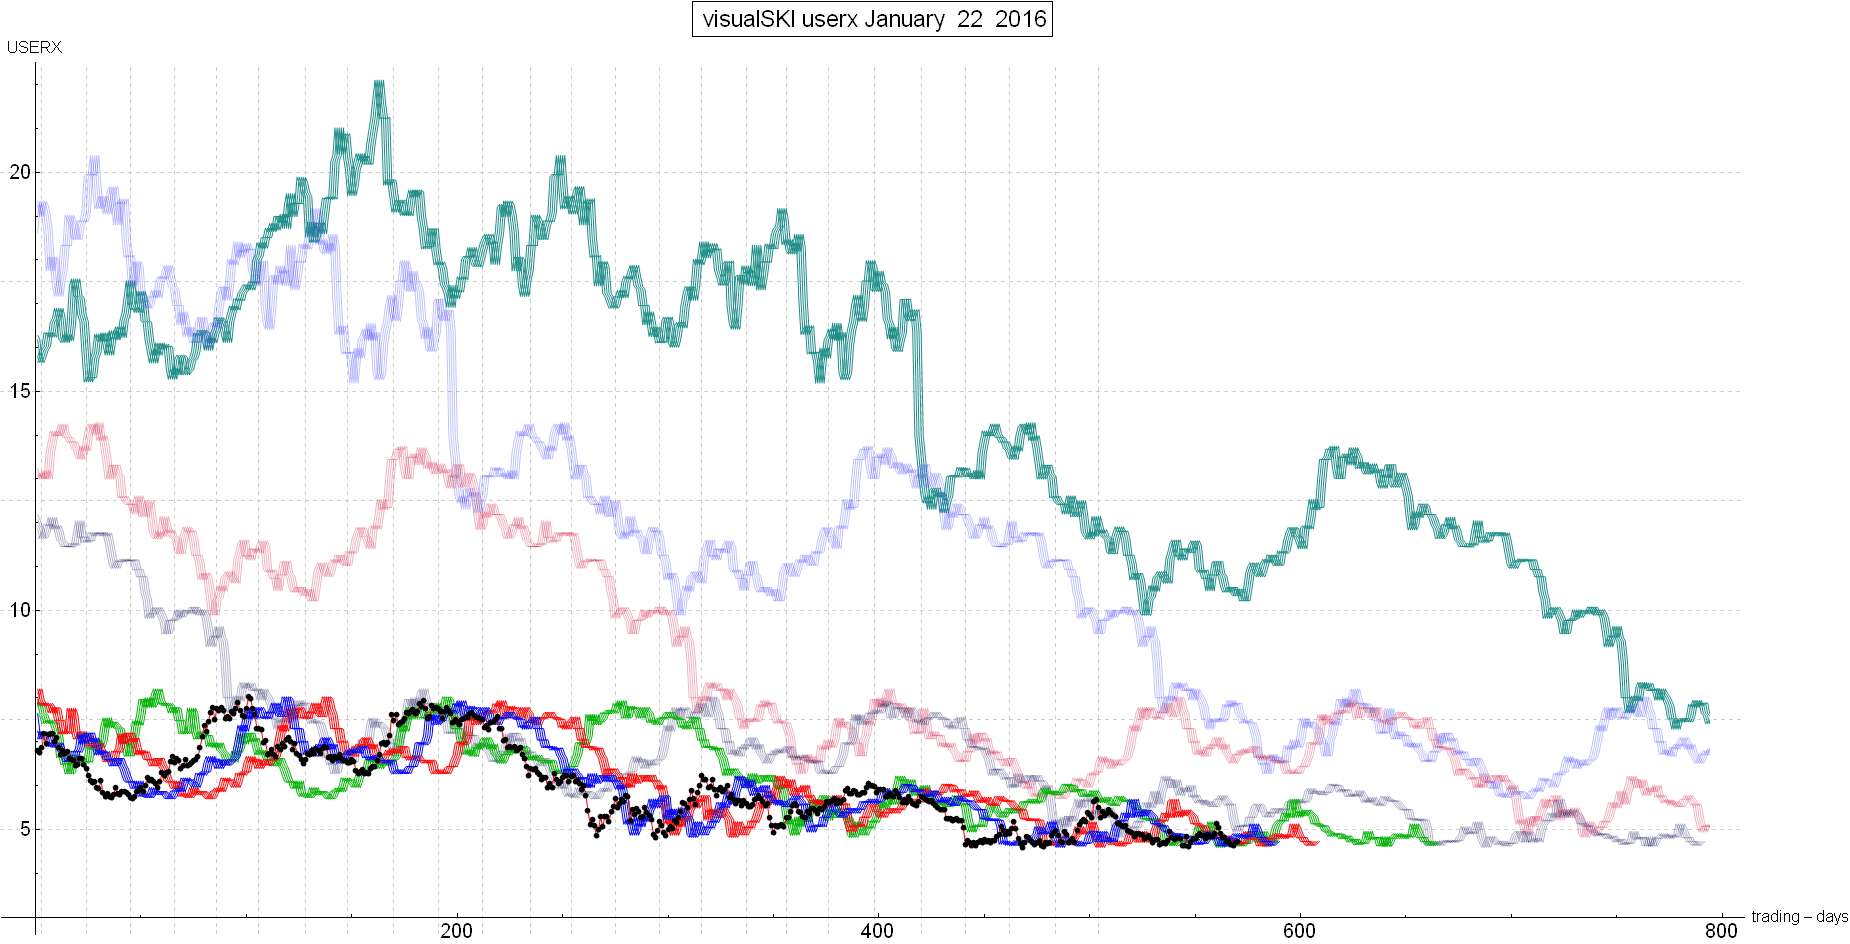
by the indices themselves. New Material The last SKI Report, described how the gold stocks (USERX) had completed a bearish 1 Down and 2 Up run pattern when they declined on 5/11/18 and that the master 92-96 index had sold. The index’s sell signal provided “Another chance at a true SKI bull market via a new 92-96 index buy signal OR the second meaningful decline of 2018 (the first such decline was after the 1/22/18 92-96 index sell signal)”. SKI and Jeff were in cash awaiting the next index signal(s). The subsequent 3 weeks have yielded further sideways movement but 5/10/18 WAS the intermediate-term top at USERX 5.80. That still does not mean that the market cannot enter a new 92-96 index SKI bull market. As of 5/20/18, the visual presentation of the SKI indices looked like this (use the Control and + keys to enlarge the graph and move towards the right to see the most recent situation; the black dots are the USERX daily price, the green line is the master 92-96 index, the red line is the intermediate-term 35-39 index, and the blue line is the short-term 16-20 index). You should be able to see how USERX had just gone below the green line right after the 5/10/18 top. MORE IMPORTANTLY, look a little to the right of where the black dots end. The black dots were the USERX price as of 5/20/18, but we use the indices to predict the future. A little to right of where the black dots end, you should be able to see that the green, red, and blue index lines were going to converge (come together) where the blue line ends (and the blue line always ends 16-20 trading days later because it is the visual presentation of the 16-20 index). Such convergences almost always mark the time for major technical points and they are not common. And when I counted 16-20 trading days forward from 5/20/18, that coincided with the next U.S Federal Reserve announcement date on 6/13/18, along with the next announcement dates for the European Central Bank and the Bank of Japan. Although most U.S. Federal Reserve announcements do not occur at critical technical points, this one was going to coincide with the convergence of the SKI indices. That “fit with” the likely importance of this coming week. The gold stocks were expected to either go sideways or decline into that convergence point. Now look at the same visual presentation as of now, 14 trading days later (there was a holiday that closed the market for one trading day during the past 3 weeks). The critical point is due in 2 – 6 trading days. USERX remains below the master green line, but see how the index line will soon begin its plunge from the mid-January 2018 gold stock high. USERX is also now sitting just a few pennies above the red line and is below the blue line. It went below the rising blue line during this past week to generate a 16-20 index buy signal. That index buys on declines and sells on rises. Therefore, SKI generated a buy signal as it fell to a one-month low at 6/04/18 at 7.56. Unfortunately for the bullish case, that buy signal was highly questionable because it came immediately after the master 92-96 index’s sell signal, but it could still have marked a low. Conclusion The SKI indices must/will (100% mathematically) generate one or more index signals during this coming week. There isn’t a new prediction until the signal(s) generate this week. If USERX can get back above the master green 92-96 index line, it would be a potential (likely) bull market buy signal. Better yet for the bullish case, if USERX can drop a little during the early part of this coming week to below the red line and then rebound back over the green line and THEN over the red line, we’d get a SKI longer-term bull market Double Buy (very similar to the last time that occurred in January 2016; Here’s the SKI chart from 1/23/2016, see how it’s just going over the green line first and then the red line and then the blue line?. The second scenario would occur if USERX went back over the red line and THEN the green line for a powerful intermediate-term (multi-month) rise. Of-course the bears want a decline that stays below that plunging green 92-96 index line during the next month. These next index signals should yield a multi-month (or longer) prediction. Most analysts and people appear to believe that the gold stocks have been extremely “boring” and meaningless recently (i.e., in the “summer doldrums), but SKI caused Jeff to be on “hyper-alert” during this past week and henceforth because just a few USERX pennies either way make a big difference as to whether an index buy or sell signal does or does not generate; The indices are usually (not always) extremely precise. Cheers, Jeff If you are interested in following and learning more about the SKI indices, I'll write another Report in three weeks or you can shell out the big bucks for a SKI subscription. Weekly Updates are available by subscribing for a month (or longer if you're wise and cheap enough to want to save money) at my website www.skigoldstocks.com for the princely sum of $25 (for a one month subscription) or more ($200 for an annual subscription). I also provide more frequent intra-week daily messages/alerts at a slightly higher price along with access to our informative Forum. ###  SKI archives SKI archives
email: jeff@skigoldstocks.com
Jeffrey M. Kern,Ph.D., is an academic psychologist with a specialty in the measurement and prediction of human behavior. The communications provided are for informational purposes only and are not intended to be investment advice or recommendations for specific investment decisions. Dr. Kern is not a registered investment advisor, but is registered as a commodity trading advisor (CTA). The information provided is considered accurate, but cannot be guaranteed. Investments/trading in narrow market segments or gold futures is for individuals willing to accept a higher level of risk for the opportunity of greater returns. Past performance is no guarantee of future performance. His website is www.skigoldstocks.com.
Communications should be sent to: jeff@skigoldstocks.com.
Copyright © 2002-2024 Jeffrey Kern. All Rights Reserved. 321gold Ltd

| 