 Special SKI Report #252 Special SKI Report #252
Gold Stock Update Jeffrey M. Kern, Ph.D.
Email: jeff@skigoldstocks.com
USERX | historicals
Written Sunday Apr 18, 2021
Published Apr 19, 2021 Current USERX price = 13.32, Up $1.24 (10.3%) since the last report 3 weeks ago. Introduction (repeated from prior Reports):
I have been using my unique SKI indices
to predict price changes in the precious metals' market for more
than two decades. And my indices continue to mark the critical
points. I have initiated a subscription website since 1/13/06
(yes, Friday the 13th) after having posted free updates for years
at www.321gold.com. SKI is a timing service; although
almost everyone seems to believe that market timing is impossible,
that IS what the SKI indices have done for 36 years.
The SKI indices contain short-term (16-20
trading days), intermediate-term (35-39 trading days), and long-term
(92-96 trading days) indices. A more comprehensive description
of these mathematical indices and their history is found here.
Basically, the indices compare today's price to prices from a
specified prior time period. The name of the index specifies the
time period (e.g., 92-96 index = compare today's price to prices
from 96, 95, 94, 93, and 92 trading days earlier). Although I
use the oldest gold mutual fund, USERX, for analyses, the predictions
are applicable to the broad precious metals' market. I do not
recommend or analyze specific stocks, but my subscribers from
around the world regularly discuss individual issues on our Forum.
In addition to the truly unique SKI indices, I also use "run
patterns" to guesstimate turning points in the precious metals'
market. A "run" refers to a pattern of daily up and
down market closing prices. If the market has 3 consecutive days
of higher closing prices, the run is "3 up". If prices
then decline for 2 consecutive days, the run becomes "3 up
and 2 down". If prices then close higher the next day, the
run changes to "2 down and 1 up". Some people have referred
to run patterns as "worms". A run pattern is only completed
after the direction of closing prices has changed. I have compiled
a listing of every run pattern that has ever occurred and generated
probabilities that the end of the run marks a high or a low, moderated
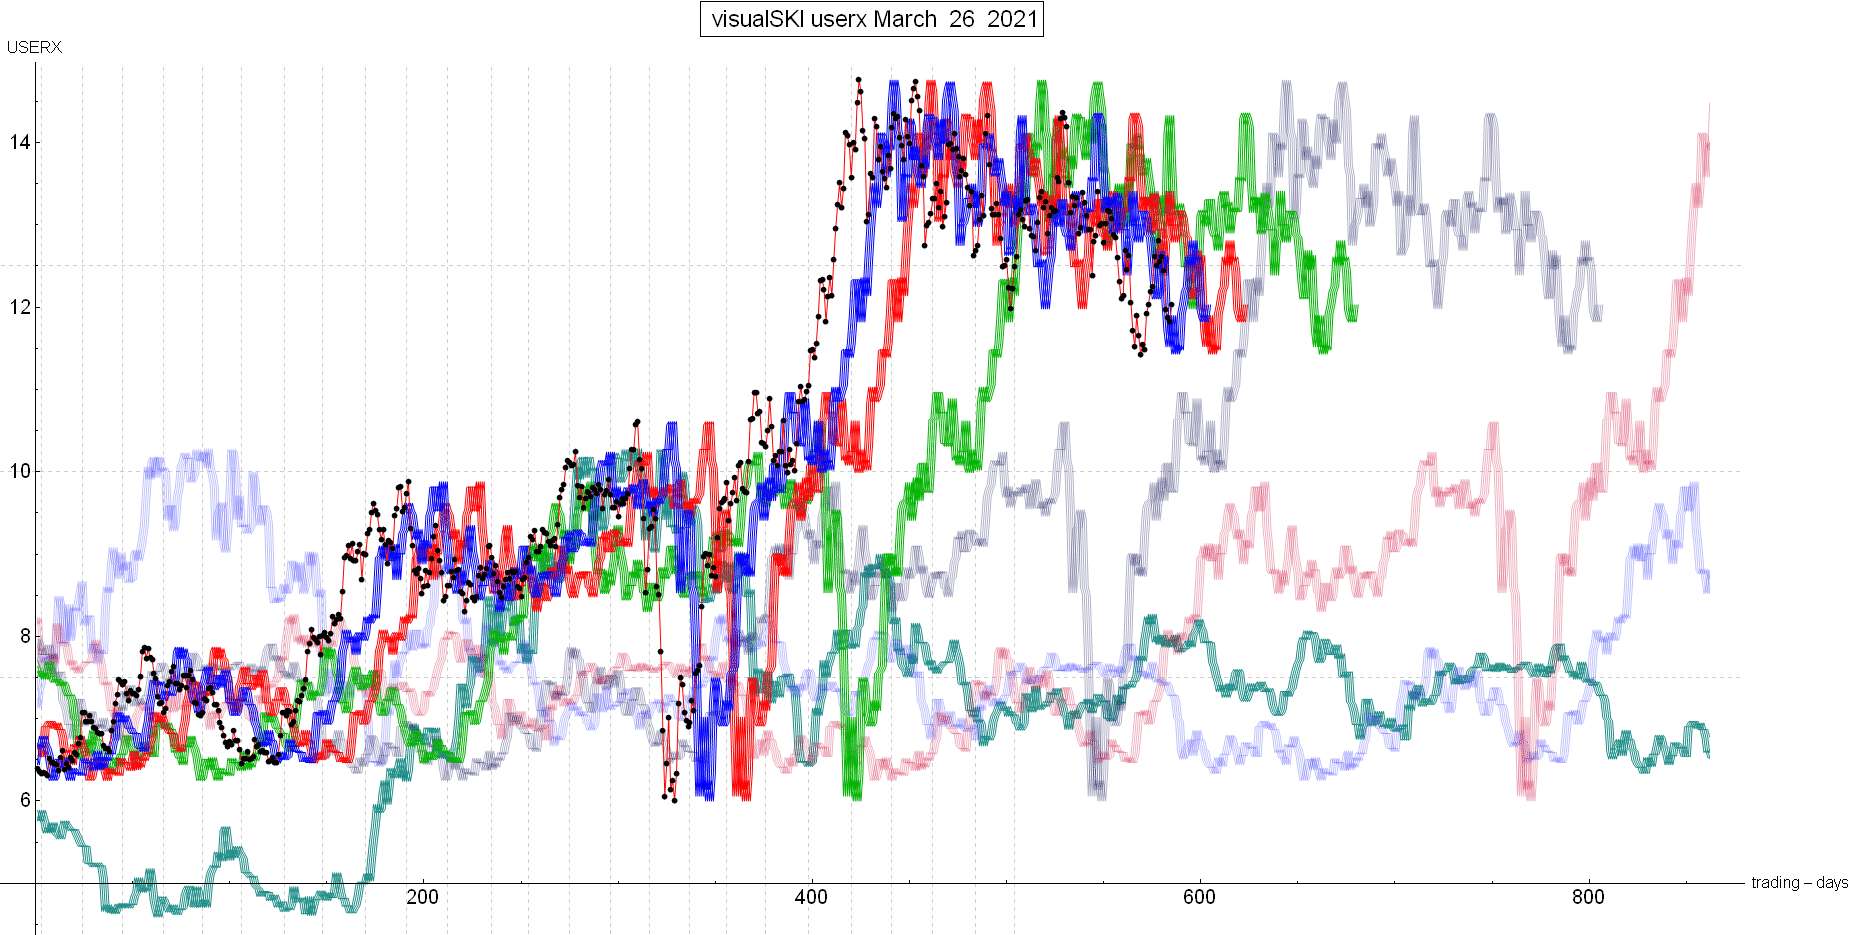
by the indices themselves. New Material The last SKI Report, written on 3/28/21, described how Mechanical SKI had been “activated”: The first resistance 16-20 index’s sell signal had generated at the 3/17/21 high and hit/touched the resistance 35-39 and 92-96 indices. That meant that Mechanical SKI would (100% mathematical certainty) buy on a decline to below the prices from 16-20 trading days earlier (likely at new multi-month low) OR that prices would rise a little more into actual 35-39 and/or 92-96 index “buy” signals. I also wrote how it was totally possible that “THE” multi-month corrective low had already occurred on 3/04/21 at USERX 11.43, but the perfect buy would occur on one more drop for a “wash-out/capitulation low” into a 16-20 index buy signal at a lower low. A decline during the next week was the expectation and the recommended time to join SKI. The ensuing 2-day plunge in gold and USERX smashed the 16-20 index towards the “nirvana” buy signal. Note how the HUI and GDX actually rose a little on 3/29/21, but USERX dropped 1.5% and gold dropped $20.10, before plunging the next day. Once again, Jeff says “Follow USERX”. A further plunge for 2 trading days, to a new multi-month low at below USERX 11.43, would have generated the rather perfect 16-20 index buy signal, but the gold stocks rebounded strongly during the next 2 trading days. The small gold stock GDXJ index DID make a new multi-month low, USERX came within 6 cents of making a new low, gold basically tied its multi-month low, and other indices (such as the strong Australian XGD index; USERX has 10+% in Australian gold stocks) made a higher low. Therefore, the SKI-perfect buy signal was avoided. The following chart of the SKI indices shows how USERX’s prices (the black dots) declined to the supportive blue line 16-20 index but did not go below the line for the “perfect” buy signal as of the end of that week. That’s because the prices from 16-20 trading days earlier were exactly at the prior 11.43 low. NOTE HOW THE SUPPORTIVE BLUE 16-20 INDEX LINE HAD BOTTOMED AND THE SUPPORT WAS RISING. Click here. That rising support, whereby any brief decline would generate a 16-20 index buy signal, allowed SKIers to buy after those first 2 daily rises. SKI had missed buying the exact low because most gold stocks only challenged the prior low and did not make a new low, but we had a nice entry opportunity. The subsequent rise was supposed to and did go up to the 92-96 and 35-39 indices as simple index math (and history) had forecast in the 3/28/21 public SKI Update. The 92-96 index generated its buy signal on 4/09/21 when USERX rose to 12.87. And the 35-39 index executed its buy signal on 4/14/21 at USERX 12.73, along with the HUI executing a new bullish 221 index buy signal PLUS a new bullish 35-39 index buy signal. NOTE how USERX went right back up to just above the 3/14/21 high at 12.87 that had generated the 16-20 index’s sell signal described in the 3/28/21 public Update. That was normal historical behavior. The only thing that matters now is the SKI sell-stop: A decline to below the prices from 92-96 trading days earlier. On this past Thursday (4/15/21), that index’s back prices rose to USERX 13.12. USERX rose from 12.73 to 13.16 on that exact day to stay above the 92-96 index’s rising back prices. And there were all of those index buy signals on 4/12/21-4/14/21 that should and DID rather exactly mark THE next technical “spot” (that’s what the index signals “do”; I don’t know “why” or “how”, but it just keeps happening since 1974). The exact rise to above USERX 13.12 on 4/15/21 is likely to have been the next bullish break-out for a rise to (above) the nice RISING sell-stop. The green line 92-96 index is rising over the next month to the early January2021 top of 14.32. Sell if USERX fails to stay above that rising index. Jeff expects that when I write the next public Update in 3 weeks, USERX will still be above that rising master 92-96 index. But again, Jeff’s “prediction” of a continuing rise is much less important than having and using the RISING objective sell-stop. Best wishes, Jeff If you are interested in following and learning more about the SKI indices, I'll write another Report in three weeks or you can shell out the big bucks for a SKI subscription. Weekly Updates are available by subscribing for a month (or longer if you're wise and cheap enough to want to save money) at my website www.skigoldstocks.com for the princely sum of $30 (for a one month subscription) or more ($240 for an annual subscription). I also provide more frequent intra-week daily messages/alerts at a slightly higher price along with access to our informative Forum. ###  SKI archives SKI archives
email: jeff@skigoldstocks.com
Jeffrey M. Kern,Ph.D., is an academic psychologist with a specialty in the measurement and prediction of human behavior. The communications provided are for informational purposes only and are not intended to be investment advice or recommendations for specific investment decisions. Dr. Kern is not a registered investment advisor, but is registered as a commodity trading advisor (CTA). The information provided is considered accurate, but cannot be guaranteed. Investments/trading in narrow market segments or gold futures is for individuals willing to accept a higher level of risk for the opportunity of greater returns. Past performance is no guarantee of future performance. His website is www.skigoldstocks.com.
Communications should be sent to: jeff@skigoldstocks.com.
Copyright © 2002-2024 Jeffrey Kern. All Rights Reserved.
321gold Ltd

| 