 Special SKI Report #151 Special SKI Report #151
Gold Stock Update Jeffrey M. Kern, Ph.D.
Email: jeff@skigoldstocks.com
USERX | historicals
Written Mar 22, 2015
Published Mar 23, 2015 Current USERX price = 5.42, Down 36 cents (6%) since the last report 3 weeks ago. Introduction (repeated from prior Reports):
I have been using my unique SKI indices
to predict price changes in the precious metals' market for more
than two decades. And my indices continue to mark the critical
points. I have initiated a subscription website since 1/13/06
(yes, Friday the 13th) after having posted free updates for years
at www.321gold.com. SKI is a timing service; although
almost everyone seems to believe that market timing is impossible,
that IS what the SKI indices have done for 36 years.
The SKI indices contain short-term (16-20
trading days), intermediate-term (35-39 trading days), and long-term
(92-96 trading days) indices. A more comprehensive description
of these mathematical indices and their history is found here.
Basically, the indices compare today's price to prices from a
specified prior time period. The name of the index specifies the
time period (e.g., 92-96 index = compare today's price to prices
from 96, 95, 94, 93, and 92 trading days earlier). Although I
use the oldest gold mutual fund, USERX, for analyses, the predictions
are applicable to the broad precious metals' market. I do not
recommend or analyze specific stocks, but my subscribers from
around the world regularly discuss individual issues on our Forum.
In addition to the truly unique SKI indices, I also use "run
patterns" to guesstimate turning points in the precious metals'
market. A "run" refers to a pattern of daily up and
down market closing prices. If the market has 3 consecutive days
of higher closing prices, the run is "3 up". If prices
then decline for 2 consecutive days, the run becomes "3 up
and 2 down". If prices then close higher the next day, the
run changes to "2 down and 1 up". Some people have referred
to run patterns as "worms". A run pattern is only completed
after the direction of closing prices has changed. I have compiled
a listing of every run pattern that has ever occurred and generated
probabilities that the end of the run marks a high or a low, moderated
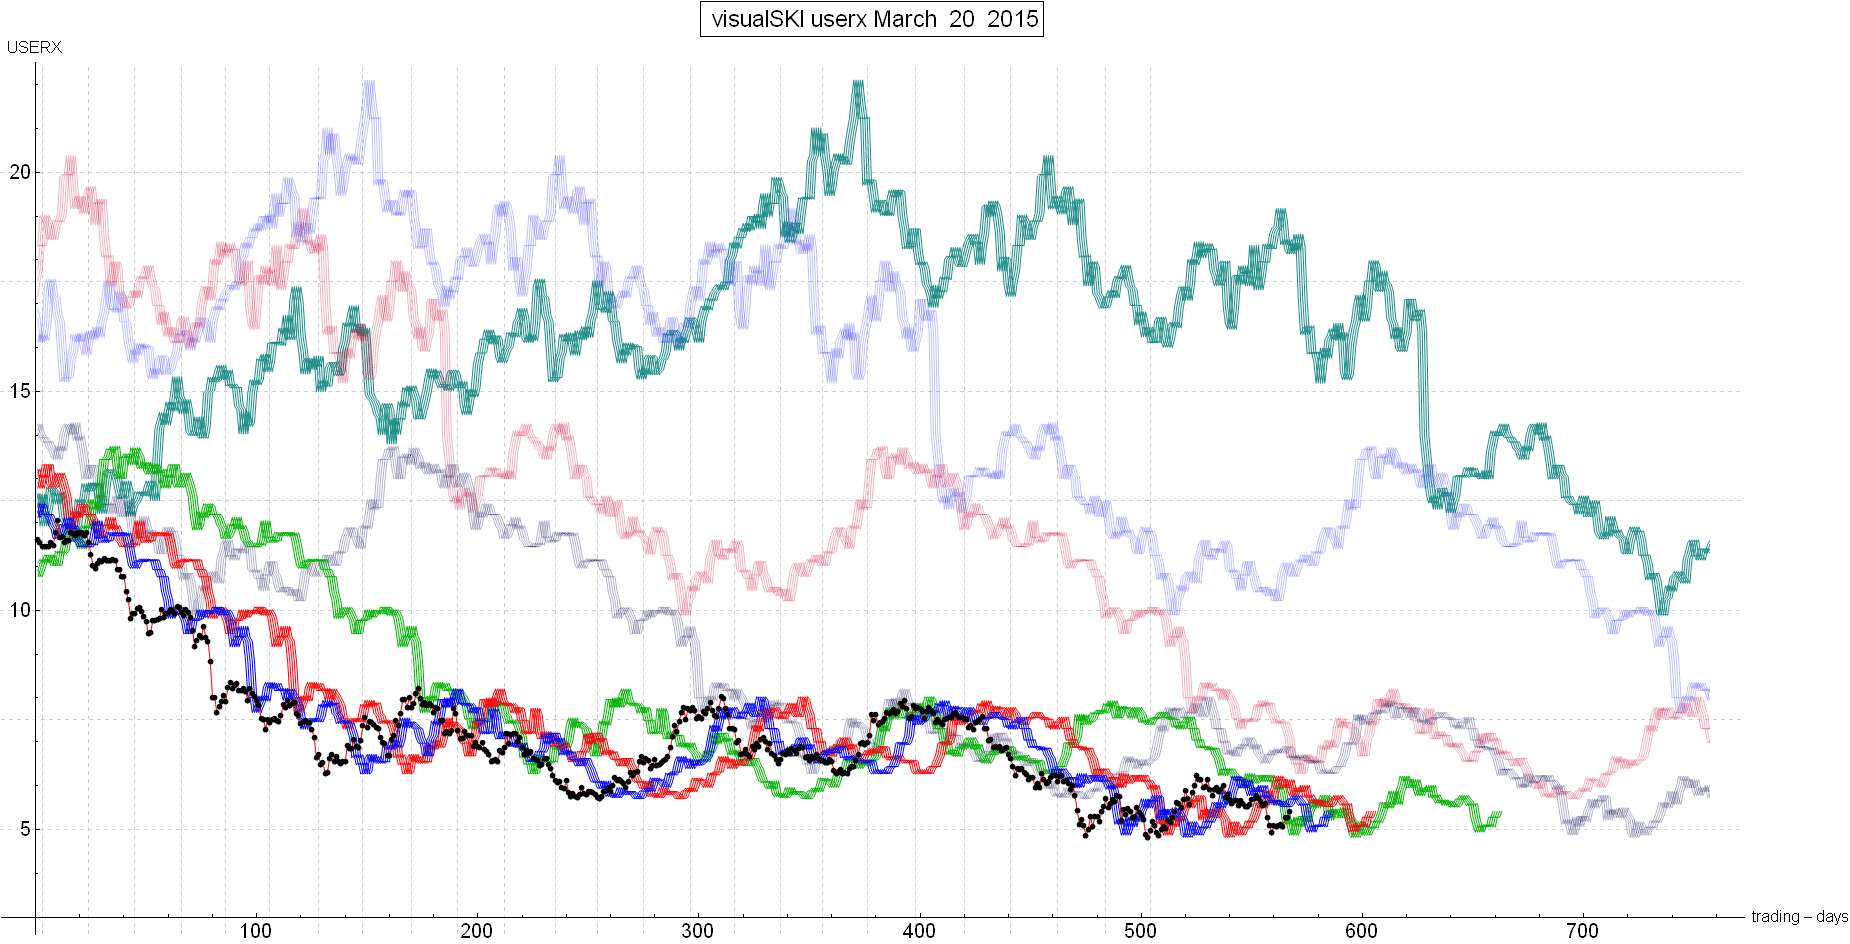
by the indices themselves. New Material The last gold stock SKI Report, written on Sunday 3/01/15, continued to report that the sell-stops from the 12/16/14 buy signal had not been activated. Those sell-stops were a decline to below USERX 5.49 and/or a 35-39 index sell signal (i.e., falling below the prices from 35-39 trading days earlier). The last SKI Report for 321gold coincided with a short-term high and the gold stocks declined during the following week. By Thursday 3/05/15, with USERX closing at 5.59, the 35-39 index’s sell-stop was going to be activated if USERX declined by just 2 cents on Friday 3/06/15. Subsequent to the U.S. Employment Report early that Friday morning, gold and the gold stocks were clearly plunging several percent and both sell-stops were clearly activated. Jeff sold as quickly as possible. As that day’s decline accelerated, USERX closed all the way down at 5.28. On the day after the sell-stop was hit, the SKI Weekend Update stated (in capital letters): “IT WOULD BE NORMAL BEHAVIOR IF USERX BOTTOMED SOON ON A SHORT-TERM BASIS (likely below Friday’s closing price of 5.28) AND THEN ROSE BACK TO ABOVE FRIDAY’S CLOSING PRICE OF 5.28 TO REACH THE 92-96 INDEX’S RESISTANCE. In 11 trading days, the 92-96 index’s five back prices are all at 4.87 – 5.23. Therefore, a rise to over 5.23 would generate the XXed Out 92-96 index buy signal. Doesn’t that fit rather perfectly with the market rising back above Friday’s USERX price of 5.28 to make anyone who sold on Friday consider the likelihood that they shouldn’t have sold or should buy back?”. It’s now been 10 trading days since that weekend Update and the gold stocks (USERX and the HUI) HAVE risen back to go over the prices from 92-96 trading days ago. The rise occurred after Wednesday’s U.S. Federal Reserve announcement. I CANNOT report that Jeff or SKI could clearly predict the rise at the end of this past week, but the rise did “fit” with the indices. What’s likely to happen going forward? It’s easiest to refer to the chart of the SKI index lines. USERX has just gone over the green line 92-96 index (click: http://imagizer.imageshack.us/a/img673/7049/V6FWTp.gif). You can see how the 3/06/15 – 3/10/15 plunge coincided exactly with the decline below the red line and how USERX rose this past week back above the green line. The situation going forward is far from definitive and requires several IF statements. First, a decline back below the rising green line would be bearish but would open the SKI indices to any new buy signal. Such a buy signal would take time to have any chance of developing. Second, a rise or sideways movement to over the blue line (for a 16-20 index sell signal) in about XX trading days, and then an immediate (almost next day) failure to stay over the rising green line, would generate a highly bearish Double Sell index pattern (a 16-20 index sell signal that is quickly followed by a 92-96 index sell signal). That would strongly suggest a decline to new multi-year lows. And thirdly, a rise to above the blue line AND the red line would keep a bullish intermediate-trend alive, BUT eventually the gold stocks have to decline to below the green line 92-96 index. Unless such an intermediate-term up-trend lasts for many months the green line will be below the current price (or at least only a few percent above the current price) and the gold stocks would be highly likely to decline back down to or below the current price area…. Best Wishes, Jeff If you are interested in following and learning more about the SKI indices, I'll write another Report in three weeks or you can shell out the big bucks for a SKI subscription. Weekly Updates are available by subscribing for a month (or longer if you're wise and cheap enough to want to save money) at my website www.skigoldstocks.com for the princely sum of $25 (for a one month subscription) or more ($200 for an annual subscription). I also provide more frequent intra-week messages/alerts at a slightly higher price along with access to our informative Forum and a managed gold futures program. The precious metals are in a very long-term (decade+) up-trend but are the most precarious, volatile, and psychologically difficult market in the world (in my opinion). That's the way it's always been. ###  SKI archives SKI archives
email: jeff@skigoldstocks.com
Jeffrey M. Kern,Ph.D., is an academic psychologist with a specialty in the measurement and prediction of human behavior. The communications provided are for informational purposes only and are not intended to be investment advice or recommendations for specific investment decisions. Dr. Kern is not a registered investment advisor, but is registered as a commodity trading advisor (CTA). The information provided is considered accurate, but cannot be guaranteed. Investments/trading in narrow market segments or gold futures is for individuals willing to accept a higher level of risk for the opportunity of greater returns. Past performance is no guarantee of future performance. His website is www.skigoldstocks.com.
Communications should be sent to: jeff@skigoldstocks.com.
Copyright © 2002-2024 Jeffrey Kern. All Rights Reserved. 321gold Ltd

| 