 Special SKI Report #250 Special SKI Report #250
Gold Stock Update: Capitulation Approaches? Jeffrey M. Kern, Ph.D.
Email: jeff@skigoldstocks.com
USERX | historicals
Written Sunday Mar 7, 2021
Published Mar 8, 2021 Current USERX price = 11.54, Down $1.31 (10.2%) since the last report 3 weeks ago. Introduction (repeated from prior Reports):
I have been using my unique SKI indices
to predict price changes in the precious metals' market for more
than two decades. And my indices continue to mark the critical
points. I have initiated a subscription website since 1/13/06
(yes, Friday the 13th) after having posted free updates for years
at www.321gold.com. SKI is a timing service; although
almost everyone seems to believe that market timing is impossible,
that IS what the SKI indices have done for 36 years.
The SKI indices contain short-term (16-20
trading days), intermediate-term (35-39 trading days), and long-term
(92-96 trading days) indices. A more comprehensive description
of these mathematical indices and their history is found here.
Basically, the indices compare today's price to prices from a
specified prior time period. The name of the index specifies the
time period (e.g., 92-96 index = compare today's price to prices
from 96, 95, 94, 93, and 92 trading days earlier). Although I
use the oldest gold mutual fund, USERX, for analyses, the predictions
are applicable to the broad precious metals' market. I do not
recommend or analyze specific stocks, but my subscribers from
around the world regularly discuss individual issues on our Forum.
In addition to the truly unique SKI indices, I also use "run
patterns" to guesstimate turning points in the precious metals'
market. A "run" refers to a pattern of daily up and
down market closing prices. If the market has 3 consecutive days
of higher closing prices, the run is "3 up". If prices
then decline for 2 consecutive days, the run becomes "3 up
and 2 down". If prices then close higher the next day, the
run changes to "2 down and 1 up". Some people have referred
to run patterns as "worms". A run pattern is only completed
after the direction of closing prices has changed. I have compiled
a listing of every run pattern that has ever occurred and generated
probabilities that the end of the run marks a high or a low, moderated
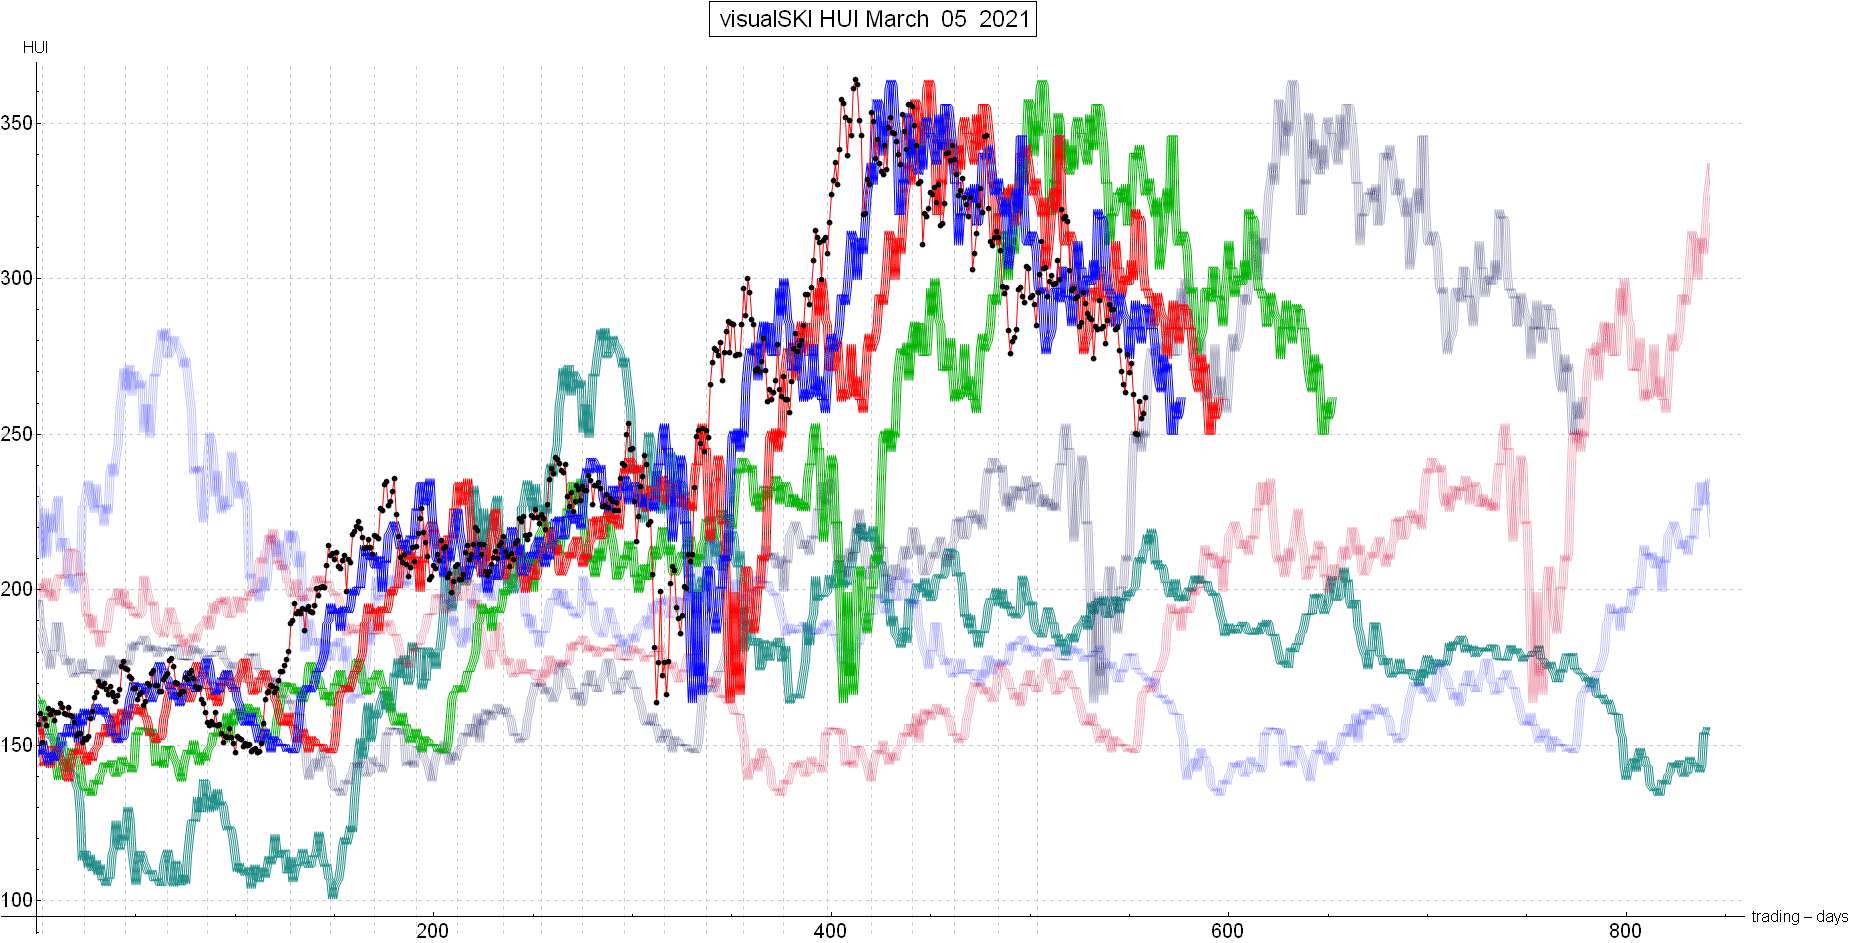
by the indices themselves. New Material The last SKI Report, written on 2/14/21, bearishly boldfaced “The current Double Sell index pattern is likely to be the most important and potentially bearish since the August 2020 top”. I provided detailed information on the USERX run pattern and my little fun “quiz” was explicitly answered that the gold stocks would likely decline on 2/16/21 to form another historically-predictive run pattern. My perhaps “braggart” style was due to THE high-probability but was intended to try to convince public readers that JeffSKI can “help”. I carry that burden and pleasure. And so, the second special Life Run low began to form as USERX declined to 12.60 on 2/16/21. USERX was then 1 Down, 2 Up, and 5 consecutive daily declines at USERX. I ask you to remember the simple rules that were described (for the umpteenth time) 3 weeks ago: “A Life Run low is 2 days Up and 5 or more consecutive daily declines. It often begins with a 1 Down and 2 Up run pattern for a high. The strength of the run down is definitively important: The stronger the decline, the greater the significance of the low (weak = less than a 1% average daily decline; moderate = 1.1-1.9% average daily decline; strong = 2% or more average daily decline).” The decline did not stop with that 5th daily decline on 2/16/21. It persisted into 2/18/21 for an extended 7 daily declines to USERX 12.10. Therefore, the next quiz is: “What do you make of that special run pattern based upon your knowledge of its ‘strength’?”. The decline was from 13.17 to 12.10. That was a CRAPPY-MODERATE 1.2% average daily decline. It predicted a “crappy” rise into resistance. It has never yielded a meaningful low. When USERX “somehow” closed 4-cents higher on 2/19/21, while the HUI (etc.) dropped 1%, the prediction had to be that the crappy rebound rise was “activated”. Where would the rebound go? Up to index resistance. The index immediately above was (usually is) the short-term 16-20 index. It sells on rises and buys on declines. The index’s back prices were dropping to include USERX 13.11, 12.94, 12.94, 12.39, and 12.80. SKIers were advised that a short-term rise was historically-expected but that any rise to above 12.39 should be sold into IF one was still long (in an UNdisciplined manner as SKI was bearish) OR if one wanted to play the very short-term bullish completion of that special 2 Up and 7 day run down. The “sucky” gold stocks then surged higher on the next trading day (2/22/21) to USERX 12.69 for a 4+% gain. The 16-20 resistance index had been hit/touched at over USERX 12.39 and any short-term bullish bets were completed/OFF. BTW, Jeff does not personally execute such stressful little short-term movements. And so, the gold stock and gold decline renewed with vigor. Mechanical SKI and Jeff remained bearish in worthless cash. The HUI’s decline on 2/26/21 to 250.16 went exactly into the HUI’s master 221 index that contained the back prices of 232.74, 249.27, 251.11, 247.12, and 251.84 (comparing that daily price of HUI 250.16 to its prices from 218-222 trading days earlier; is that some “magic”? No, it’s the always-the-same empiricism that reflects “the measurement of Nature”). Mathematical SKI is more exact than the following SKI chartof the HUI. The black dots are the HUI price and the purple index line is the 221 index’s pictorial presentation up to the present. NOW, actually as of the 2/26/21, that hit/touch of the HUI’s 221 index plus multiple other auxiliary indicators yielded another short-term bullish prediction/expectation. The HUI “somehow” rose 4.6% last week from that apparent low, despite a further decline in USERX and gold. Notice how that purple index line is rising and the HUI has been barely remaining above it. The Australian XGD has already sold its 221 index and then its 442 index. It remains bearish and the HUI’s expected short-term rise must be expected to fail in perhaps a week on a rise (we see) for further bearishness. USERX is primary and its 221 index is below. Remember, all public USERX charts are distorted because they understandably but WRONGLY “correct” past USERX prices for dividend and capital gain distributions. Nature tends to work in 3s. We’ve had 2 special USERX run patterns. That in itself is rare. Will there be a 3rd one? The one that is a “strong” decline for a major low? I could write so much more to try and summarize the last few weeks of SKI reports. Various sectors of the U.S. stock market and crypto-currencies have yielded parabolic rises and the expected collapses. A major moment MAY be approaching. My big SKI-nose “smells it” with empirical support and decades of experience. I’ve suggested some “systematic event” and we’ve already had two small ones in the past 2 weeks (i.e., a 2/24/21 temporary closure of the U.S. banking system and this past week’s “dislocation” in the U.S. bond market). I wrote to you 3 weeks ago that it was not yet time to join the SKI community but waves of new SKIers entered in an uncharacteristic manner. Market “craziness” abounds. If/when USERX rises for exactly 2 consecutive days sometime in the next week or so, and then starts consecutive daily declines, the 3rd and “strong” real special run pattern will likely be in process for a capitulation low. I then adamantly recommend quickly joining the SKI-community for the price of a good pizza (smile). Jeff’s into a never-before almost Biblical nutto writing mode based upon mathematical SKI and so many other auxiliary factors (e.g., it’s just one little example, but look at the bananas-going-bullish Commitment of Traders report for gold. So this Update remains overall bearish with another short-term rise expected here. At now 67 years old,I put about 30-40% of my net worth where my gold stock SKI-mouth is… but discipline is as important as any SKI index or run pattern. My very best wishes, Jeff If you are interested in following and learning more about the SKI indices, I'll write another Report in three weeks or you can shell out the big bucks for a SKI subscription. Weekly Updates are available by subscribing for a month (or longer if you're wise and cheap enough to want to save money) at my website www.skigoldstocks.com for the princely sum of $30 (for a one month subscription) or more ($240 for an annual subscription). I also provide more frequent intra-week daily messages/alerts at a slightly higher price along with access to our informative Forum. ###  SKI archives SKI archives
email: jeff@skigoldstocks.com
Jeffrey M. Kern,Ph.D., is an academic psychologist with a specialty in the measurement and prediction of human behavior. The communications provided are for informational purposes only and are not intended to be investment advice or recommendations for specific investment decisions. Dr. Kern is not a registered investment advisor, but is registered as a commodity trading advisor (CTA). The information provided is considered accurate, but cannot be guaranteed. Investments/trading in narrow market segments or gold futures is for individuals willing to accept a higher level of risk for the opportunity of greater returns. Past performance is no guarantee of future performance. His website is www.skigoldstocks.com.
Communications should be sent to: jeff@skigoldstocks.com.
Copyright © 2002-2024 Jeffrey Kern. All Rights Reserved.
321gold Ltd

| 