 Special SKI Report #199 Special SKI Report #199
MAJOR Gold Stock Update Jeffrey M. Kern, Ph.D.
Email: jeff@skigoldstocks.com
USERX | historicals
Written Sunday Feb 18, 2018
Published Feb 19, 2018 Current USERX price = 7.13, Down 66 cents (8.5%) since the last report 3 weeks ago. Introduction (repeated from prior Reports):
I have been using my unique SKI indices
to predict price changes in the precious metals' market for more
than two decades. And my indices continue to mark the critical
points. I have initiated a subscription website since 1/13/06
(yes, Friday the 13th) after having posted free updates for years
at www.321gold.com. SKI is a timing service; although
almost everyone seems to believe that market timing is impossible,
that IS what the SKI indices have done for 36 years.
The SKI indices contain short-term (16-20
trading days), intermediate-term (35-39 trading days), and long-term
(92-96 trading days) indices. A more comprehensive description
of these mathematical indices and their history is found here.
Basically, the indices compare today's price to prices from a
specified prior time period. The name of the index specifies the
time period (e.g., 92-96 index = compare today's price to prices
from 96, 95, 94, 93, and 92 trading days earlier). Although I
use the oldest gold mutual fund, USERX, for analyses, the predictions
are applicable to the broad precious metals' market. I do not
recommend or analyze specific stocks, but my subscribers from
around the world regularly discuss individual issues on our Forum.
In addition to the truly unique SKI indices, I also use "run
patterns" to guesstimate turning points in the precious metals'
market. A "run" refers to a pattern of daily up and
down market closing prices. If the market has 3 consecutive days
of higher closing prices, the run is "3 up". If prices
then decline for 2 consecutive days, the run becomes "3 up
and 2 down". If prices then close higher the next day, the
run changes to "2 down and 1 up". Some people have referred
to run patterns as "worms". A run pattern is only completed
after the direction of closing prices has changed. I have compiled
a listing of every run pattern that has ever occurred and generated
probabilities that the end of the run marks a high or a low, moderated
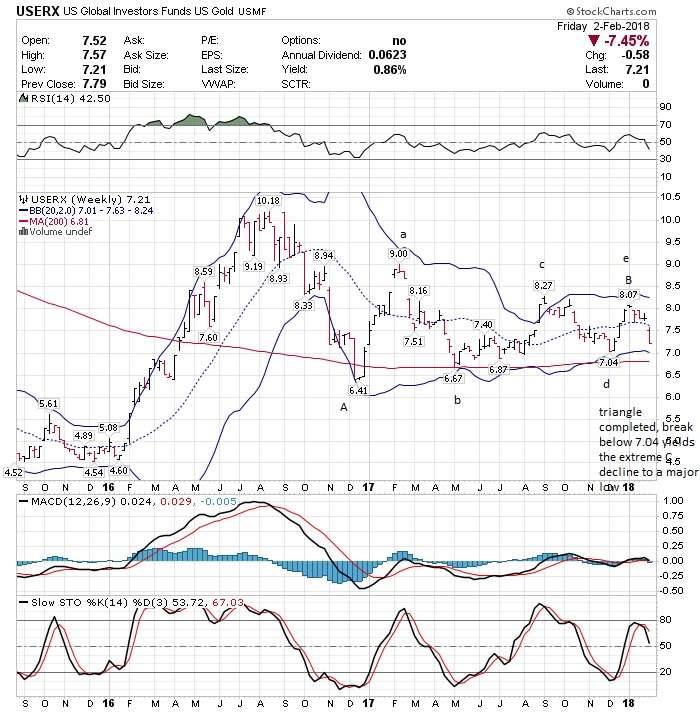
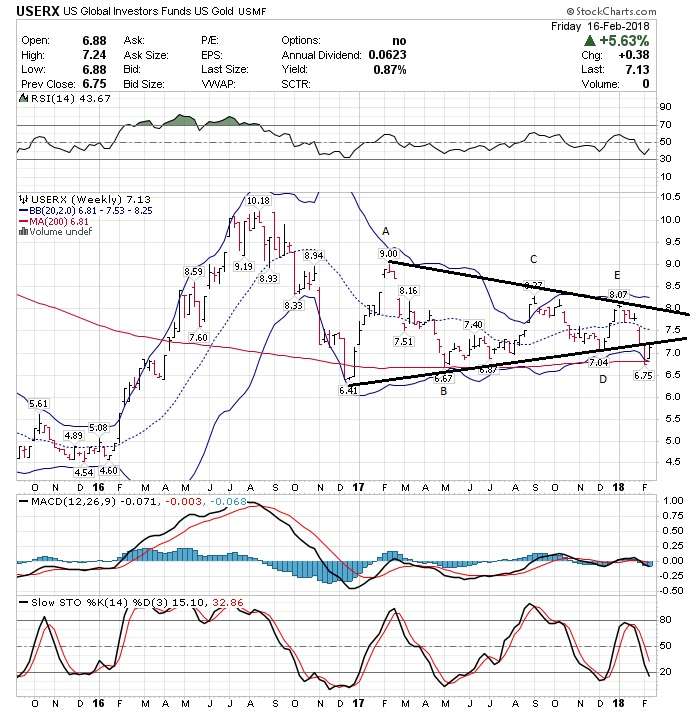
by the indices themselves. New Material This is a MAJOR bearish warning Update due to extraordinary high-probability and rare SKI index signals and run patterns. The last SKI Report, warned that the prior 12/18/17 potential bull market buy signal had failed via a master 92-96 index sell signal and more ominously, the gold stocks (USERX) were approaching likely SIMULTANEOUS 221 and 442 index sell signals. The date was reserved for subscribers. THIS UPDATE LAYS IT ALL ON THE LINE in the hope of protecting gold stock investors. Good will is good karma, but few will “believe” the historical probabilities. Since that last public report, USERX did generate those simultaneous 221 and 442 index sell signals that executed on 1/31/18 at USERX 7.56. THIS WAS SO RARE AND SO OMINOUSLY BEARISH that Jeff had to surmise that it wouldn’t just be the gold stocks that declined, but possibly all “risk-on” assets such as the general stock market. That probability was enhanced because the only other time that a potential 92-96 index bull market (from 12/18/17) had failed like that was in … 2008. I only make stock market comments to subscribers every 2-5 years. And although the gold stocks rose a small fraction the next day, the “crash” in risk-on assets then commenced. The USERX decline formed a special, rather rare run pattern of 2 days Up and 6 days Down into 2/09/18 at USERX 6.75. The 6-day run down from 7.57 to 6.75 averaged 1.8% per day. Jeff sub-classifies all historical examples of this most important run pattern based upon how much they go down. When the decline averages 2+% a day (the larger, the better), the end of the run down marks significant lows (and all-time lows). Had the gold stocks crashed on 2/09/18, Jeff would be writing a bullish report today. But the buyers came in and the gold stocks rebounded to form a weak run down that averaged less than 2% per day. After such a run down, the gold stocks had a 95% historical probability of rebounding (marking a short-term low), but such “weak” runs down have only yielded 2-8 trading day recoveries in the past 44 years. History then repeated as the 95% probability yielded a rise on last Monday (2/12/18). And the gold stocks continued to rise into Wednesday-Thursday of last week. NOTE HOW THE CORRELATION BETWEEN THE GOLD STOCKS AND THE GENERAL STOCK WAS MAINTAINED. This is rare and maintained the expectation that the markets had sold off together in a “risk-off” reaction and then rebounded together as “risk-on” assets rose. The USERX rebound last week formed a second consecutive classic predictive and rare run pattern of 6 days Down and 4 days Up. Note that only USERX rose on 2/15/18 by 1-penny to form that run pattern. Such runs higher become distinctive when they reach 4 or 5 days higher. They have never (ever) extended beyond 5 days up. The 6 Down and 4 Up run pattern has occurred only 5 times since 1974 and has always marked a high. And 6 Down and 5 Up run patterns have only occurred 3 times. Two have marked exact highs and one yielded a further rise, but that was during a SKI 92-96 index bull market (that is not present here). Therefore, although nothing can ever be 100% guaranteed, USERX was extremely likely to top on this past Thursday or Friday. When the gold stocks declined on Friday (2/16/18), the run pattern completed and the rebound top should have completed. This gets more bearish for “risk-on” asset classes. The general stock market (via Jeff’s proprietary NASDAQ-weighted mutual fund) also declined on Friday (2/16/18) to complete a rare special 5-Up run pattern. Such a run pattern is referred to as a Death Run and usually yields major declines from a secondary top. Although the SKI indices can only be applied to the gold stocks and Jeff is not an expert on the general stock market, that run pattern “fits with” a continuing close correlation between the gold stocks and the general stock market with renewed bearishness. Why does SKI/Jeff use the obscure mutual fund USERX and why does it “work”? When my academic colleague and I decided to try to predict the gold stocks and gold in 1985, USERX was the oldest mutual fund (opening in 1974; at a top, as is typical!). After surprisingly discovering SKI indices that worked, we then began the same process with the XAU, gold bullion, and ASA (ASA is a closed-ended fund that invests in South African gold stocks and still exists, but now no one seems to care about it). We could not find anything that was predictive! For decades, we pondered why SKI would work for USERX and nothing else. For the past decade, Jeff has applied SKI to the HUI and it does work a little (e.g., the HUI went into a SKI bull market a few days after USERX in January 2016). But now Jeff believes that he knows “why”. USERX is the only measure that invests directly in Australian, Canadian, U.S., South African, other countries’ gold stocks. Therefore, it takes into account currency fluctuations and its price is affected by overnight trading in other countries. As the saying goes, “Gold is only in a true bull market if it is rising against all currencies”. Jeff can change that saying to “The gold stocks are only in a bull market when they are rising in all countries and currencies”. Furthermore, the USERX run patterns are often unique because its price is affected by that overnight trading. For example, just this past Wednesday (2/14/18), Jeff wrote to SKIers that USERX was likely to extend its run higher on Thursday to the critical 4th day (to form the important 6 Down and 4 Up run pattern topping pattern) due to a likely overnight rise in the Australian gold stocks even if the HUI/GDX were flat-to lower on Thursday in U.S. trading. That’s what occurred as USERX eked out an important 1-penny gain while GDX/HUI declined a little. Therefore, analysts who do not take into currency fluctuations or use USERX for analysis are missing important information. Lastly, for you chartists, USERX frequently manifests very “nice” chart patterns. Look at the USERX chart that Jeff presented to SKIers about 3 weeks ago. It showed a rather perfect “contracting ABCDE triangle” over the past year with lower highs and higher lows: Click here. The ultra-bearish index signals caused Jeff to predict that USERX would soon decline to below 7.04 (the bottom of the triangle), then classically rebound to test the underside of that break-down, and then drop to below the December 2016 low of 6.42, before bottoming somewhere above the January 2016 low of 4.64. And so, USERX dropped to below 7.04 two weeks ago, formed the short-term bullish run pattern, and then rebounded last week back up to the bottom of the broken triangle as per this updated chart. Click here. In conclusion SKI is uber-bearish and such bearishness may include the rare participation of the general stock market. Gold bullion is more perplexing: It has probably held up as a “safe-haven” asset and could even do the extremely rare rise even as the stocks decline (doubtful due to rarity, but possible). The prediction is that USERX will soon decline to below the December 2016 low of 6.42 and could even challenge the January 2016 multi-year low. And yet, the pattern is still just “corrective” from the 2016 bull market and Jeff fully expects a massive rise when the decline completes. So, I hope that this saves you money and pain. How many analysts are willing to make this type of prediction? SINCE THERE IS NO 100% CERTAINTY, THE NICE THING IS THAT ANY CLOSE OVER USERX 7.24 WILL INVALIDATE THIS BEARISH FORECAST, and can be used as the stop-loss for continuing or new short positions. But SKI still would not turn bullish. And I hope (of-course) that you’ll join SKI if/as the gold stocks decline (not after they’ve risen) because I do not intend to provide this type of timely and specific information at the expected major bottom. Best Wishes, Jeff If you are interested in following and learning more about the SKI indices, I'll write another Report in three weeks or you can shell out the big bucks for a SKI subscription. Weekly Updates are available by subscribing for a month (or longer if you're wise and cheap enough to want to save money) at my website www.skigoldstocks.com for the princely sum of $25 (for a one month subscription) or more ($200 for an annual subscription). I also provide more frequent intra-week daily messages/alerts at a slightly higher price along with access to our informative Forum. ###  SKI archives SKI archives
email: jeff@skigoldstocks.com
Jeffrey M. Kern,Ph.D., is an academic psychologist with a specialty in the measurement and prediction of human behavior. The communications provided are for informational purposes only and are not intended to be investment advice or recommendations for specific investment decisions. Dr. Kern is not a registered investment advisor, but is registered as a commodity trading advisor (CTA). The information provided is considered accurate, but cannot be guaranteed. Investments/trading in narrow market segments or gold futures is for individuals willing to accept a higher level of risk for the opportunity of greater returns. Past performance is no guarantee of future performance. His website is www.skigoldstocks.com.
Communications should be sent to: jeff@skigoldstocks.com.
Copyright © 2002-2024 Jeffrey Kern. All Rights Reserved. 321gold Ltd

|
