 Special SKI Report: Special SKI Report:
Bull Market Corrections
Jeffrey M.
Kern, Ph.D.
Email:
jeff@skigoldstocks.com
USERX | historicals
February
11, 2006
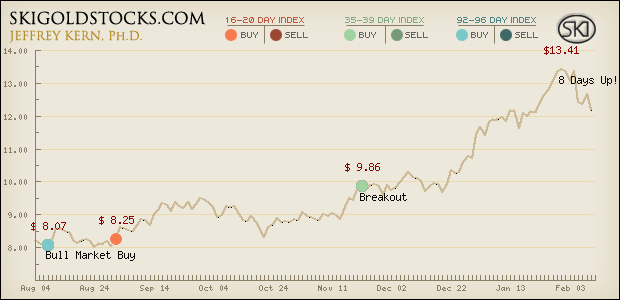
The true and rare SKI gold
bull market buy signal began on 8/09/05 at USERX, (the mutual
fund that represents the precious metals markets for SKI) 8.07.
The current price is 12.18 for a gain of 51%. The graph
below also shows the 35-39 index buy signal that correctly predicted
the great bull market break-out. The great bull should last for
many more months to many more years, but currently is in a significant
corrective phase. The intermediate high of USERX 13.41 was recorded
on the historically amazing 8th consecutive day up, just 7 trading
days ago on 2/01/06. The correction has carried us down 9% to
12.18 in the last 7 trading days.
If you are not familiar with
SKI, I had been posting weekly Updates on 321gold since its inception
some 4+ years ago after having used the indices that I'd developed
in 1985 for some 20 years. I've recently initiated my own subscription
website (as of Friday the 13th!! 2006) that uses my unique indices
to predict the movement of the broad precious metals' complex.
SKI is a pure timing service (I know, no one can time the market;
smile) that focuses on three primary mathematical indices to
mark critical time by price interaction points (not just time,
not just price, but the intersection of time AND price). I am
writing a special report this weekend on the characteristics
of bull market corrections relative to the SKI indices.
You'll read predictions stating
that the goldies are going down for another month, another 2
months, another 3 months, or another X years. The predictions
state that the gold stocks will decline another 10%, 20%, 30%,
or more. The mechanical SKI indices continue to say, "THIS
IS A TRUE AND RARE BULL MARKET". The indices continue to
work (after 31 years) in a manner that is amazing to me. I am
hyped up today (2/10/06) because USERX fell more than anything
else to 12.18. The SKI index (i.e., the 16-20 index) was at 12.17
today. Today the gold stocks fell into support at the exact penny
that I was looking for. Is that the low? The answer depends upon
your time frame: It's likely that we'll see a move up off of
support but eventually THE GOLD STOCKS ALWAYS PLUNGE DOWN TO
THE SKI INDEX SIGNALS, consistent with the free Updates that
I wrote back in early January. These stocks ALWAYS retreat back
to the indices. How often do I write with a definitive statement
such as "always" or "will"?
How long do bull market corrections
last? How far do they decline? I've written that my indices have
difficulties calling some bottoms during bear markets and some
tops during bull markets, but they are amazingly accurate in
marking highs during bear markets and lows during bull markets.
AN IMPORTANT LOW IS AHEAD OF US. SKIERS SHOULD ANTICIPATE PROFITS
OF 50-70% ON THE ENSUING RISE.
This weekend's Special Report
details all of the rises and subsequent declines during bull
markets so as to help pinpoint the bottom. I detail the length
and depth of every gold stock surge and plunge during bull markets.
Declines of 10-12% in ONE day are normal bull market behavior.
Last Tuesday's (2/07/06) 7% decline is common during a true bull
and we will witness 12-15% gold stock declines in a single day
as the bull progresses. The historical data provide the courage
and the indices provide the buy point(s).
I am writing to report that
history demonstrates a recurring pattern marking the end of corrections
during bull markets. Such patterns involve specific time periods,
% declines, and SKI index signals that all occur simultaneously
to mark the corrective low. In brief, BULL MARKET CORRECTIONS
ARE RELATIVELY FAST AND HARD. (The word "relatively"
is the hedged word that requires a more explicit definition contained
in the Special Report).
The details and the SKI index signals regarding such bull market
lows are provided in the Special SKI Report that I will be publishing
and sending to subscribers this Sunday. I've always provided
my information to the public without any personal compensation,
but now that the subscription website is functioning, I find
myself in the strange and somewhat unsavory position of having
to restrict additional critical information to my skiers. Therefore,
I am actually writing to alert you to the fact that this correction
low is callable based upon the SKI indices (as I've stated for
months), that the time frames and %s provided in articles from
other "gurus" don't appear to match the history of
my indices, and that this is the time to focus on my website
www.skigoldstocks.com for one of the better trade/investment
opportunities of my life. The decline will be quite severe, but
this report and my weekly (or more frequent) Updates will now
be focusing on the bottom of the bull market correction (as opposed
to the website's recent focus on calling the high).
The Special SKI Report, as
well as my regular weekly Updates, are available this Sunday
(and thereafter) by subscribing for a month (or longer if you're
wise and cheap enough to want to save money) at my website www.skigoldstocks.com
for the princely sum of $25 (for a one month subscription) or
more ($200 for an annual subscription). And if you remember,
I don't want a subscription cost to deter "the small investor"
or "the person with special circumstances" from subscribing/profiting.
If the above applies, write to me at jeff@skigoldstocks.com.
I hate being a salesperson but opportunity is approaching.
Best wishes,
Jeff
February 10, 2006
P.S. The website has been a
pleasure. Skiers are being supportive and nonjudgmental. Join
me at the SKI scientific family for the knowledge, the experience,
and the gold stock profits! If you're a long-term buy-and-holder,
stay long until a 92-96 index sell signal, but for a few bucks
you can enjoy my Updates, know when to add, and also know when
the SKI bull ends! I'm a great salesperson with a truly professional
sales pitch and that cute new graph, huh?
Jeffrey M.
Kern, Ph.D., is an academic psychologist with a specialty in
the measurement and prediction of human behavior. The communications
provided are for informational purposes only and are not intended
to be investment advice or recommendations for specific investment
decisions. Dr. Kern is not a registered investment advisor, but
is registered as a certified trading advisor (CTA). The information
provided is considered accurate, but cannot be guaranteed. Investments/trading
in narrow market segments or gold futures is for individuals
willing to accept a higher level of risk for the opportunity
of greater returns. Past performance is no guarantee of future
performance. His website is www.skigoldstocks.com.
Communications
should be sent to: jeff@skigoldstocks.com.
Copyright ©2002-2006
Jeffrey Kern. All Rights Reserved.
321gold Inc

|
