 Special SKI Report #149 Special SKI Report #149
Gold Stock Update
Jeffrey M. Kern, Ph.D.
Email: jeff@skigoldstocks.com
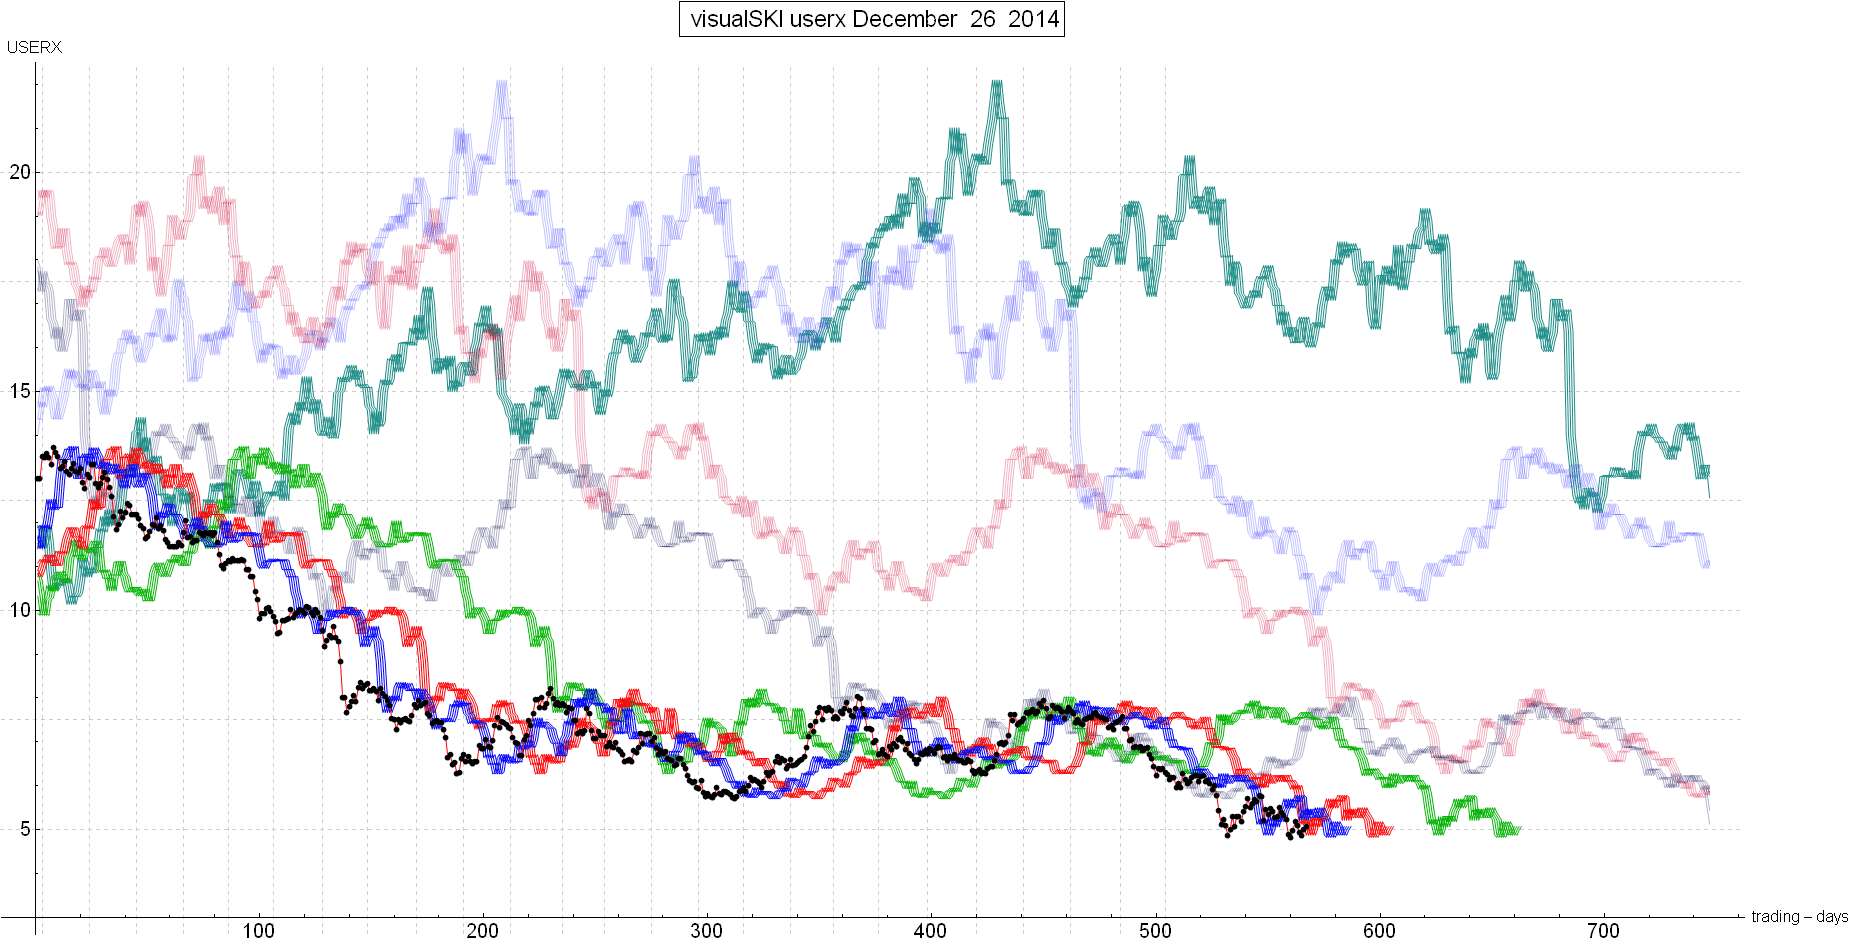
USERX
| historicals
Written Sunday Feb 8, 2015
Published Feb 9, 2015
Current USERX price = 5.73, Down 27 cents (4.5%) since the last report 3 weeks ago.
Introduction (repeated from prior Reports):
I have been using my unique SKI indices
to predict price changes in the precious metals' market for more
than two decades. And my indices continue to mark the critical
points. I have initiated a subscription website since 1/13/06
(yes, Friday the 13th) after having posted free updates for years
at www.321gold.com. SKI is a timing service; although
almost everyone seems to believe that market timing is impossible,
that IS what the SKI indices have done for 36 years.
The SKI indices contain short-term (16-20
trading days), intermediate-term (35-39 trading days), and long-term
(92-96 trading days) indices. A more comprehensive description
of these mathematical indices and their history is found here.
Basically, the indices compare today's price to prices from a
specified prior time period. The name of the index specifies the
time period (e.g., 92-96 index = compare today's price to prices
from 96, 95, 94, 93, and 92 trading days earlier). Although I
use the oldest gold mutual fund, USERX, for analyses, the predictions
are applicable to the broad precious metals' market. I do not
recommend or analyze specific stocks, but my subscribers from
around the world regularly discuss individual issues on our Forum.
In addition to the truly unique SKI indices, I also use "run
patterns" to guesstimate turning points in the precious metals'
market. A "run" refers to a pattern of daily up and
down market closing prices. If the market has 3 consecutive days
of higher closing prices, the run is "3 up". If prices
then decline for 2 consecutive days, the run becomes "3 up
and 2 down". If prices then close higher the next day, the
run changes to "2 down and 1 up". Some people have referred
to run patterns as "worms". A run pattern is only completed
after the direction of closing prices has changed. I have compiled
a listing of every run pattern that has ever occurred and generated
probabilities that the end of the run marks a high or a low, moderated
by the indices themselves.
New Material
The last gold stock SKI Report, written on Sunday 1/18/2015, was a follow-up to the definitively bullish SKI Report from 12/28/14 describing the 16-20 index buy signal and bullish run pattern low from 12/16/14. Those Reports were succinct and (hopefully) clear. The 1/18/15 Report concluded that it was tempting to take profits after a 24% rise in USERX and the 33% rise in the HUI from the 12/16/14 buy, but that the intermediate-term trend should still be bullish UP INTO THE 92-96 INDEX’S RESISTANCE (which was the upside target reported in the 12/28/14 public Report).
Since the last SKI Report, the gold stocks surged 3.5% higher on the next trading day (1/20/15) up to USERX 6.22, but have subsequently spent 3 weeks going sideways to lower. This past Friday’s (2/06/15) harsh decline established a new low since the 1/20/15 top and gold’s $28.10 decline on Friday was particularly harsh.
The prediction from the 12/16/14 buy signal was that the gold stocks would rise to the 92-96 index (the green line in the 12/28/14 Report’s complimentary SKI chart) where Jeff would be selling. That prediction was based upon the history of such index signals since USERX became the first gold stock mutual fund in 1974. It was not “subjective”, but historical patterns cannot be “guaranteed”.
USERX has NOT (yet?) reached its 92-96 index. The lowest of the five index back prices is at 6.23, one penny above the 1/20/15 high of 6.22. You can go back 92-96 trading days to verify that, but you can always take my word on the indices because they are objective and verifiable. However, on this past Thursday (2/05/15), the HUI’s 92-96 index resistance WAS hit/touched. The index’s lowest back price was at 202.47 and the HUI closed at 203.93! Therefore, Friday’s harsh decline was NOT predicted, but it did demonstrate the 92-96 index’s resistance.
Friday’s harsh decline DID hit/touch the supportive 16-20 index for the first time since the 12/16/14 buy signal. A further brief decline would generate another supportive 16-20 index buy signal, but the historical precedent is that such a buy signal won’t occur. Of-course the historical precedent also was that the 16-20 index wouldn’t even get hit/touched and it did so on this past Friday! Could this time be different and actually generate the 16-20 index’s buy signal on a further short-term decline? There aren’t any “certainties”. And there cannot be a guarantee that a new 16-20 index buy signal would yield an immediate rise because it would be unique. The 12/16/14 16-20 index buy signal was not questioned, but this buy signal would be the first time (since gold trading began in the 1970s) that there’s been a decline large enough to reach the 16-20 index after the kind of buy signal that was executed on 12/16/14.
Conclusion
The 12/16/14 index and simultaneous run pattern buy signals may have marked a long-term bottom for the gold stocks, but that still can’t be confirmed without more up and down movements. The immediate issue concerns whether there’s been an intermediate-term top on 1/20/15 for the gold stocks, and shortly thereafter, for gold. The HUI rose into 92-96 index resistance on this past Thursday and then plunged into 16-20 index support on Friday (2/06/15). Therefore: (1) Friday could have been a low with a rise over the next few weeks into the expected 92-96 index’s major resistance index signal (for an intermediate-term top), (2) A further short-term decline would generate an unexpected 16-20 index supportive buy signal, and (3) A downside break of such a buy signal would be “Armageddon” with forthcoming new multi-year lows. One of these occurrences should occur during the next few weeks. I understand that this Report may not be predictive, but it’s important to know what you don’t know. Be careful here. One or the other of the index signals has to (mathematically) occur within the next few weeks…
Best Wishes, Jeff
If you are interested in following and learning more about the SKI indices, I'll write another Report in three weeks or you can shell out the big bucks for a SKI subscription. Weekly Updates are available by subscribing for a month (or longer if you're wise and cheap enough to want to save money) at my website www.skigoldstocks.com for the princely sum of $25 (for a one month subscription) or more ($200 for an annual subscription). I also provide more frequent intra-week messages/alerts at a slightly higher price along with access to our informative Forum and a managed gold futures program. The precious metals are in a very long-term (decade+) up-trend but are the most precarious, volatile, and psychologically difficult market in the world (in my opinion). That's the way it's always been.
###
 SKI archives SKI archives
email: jeff@skigoldstocks.com
Jeffrey M. Kern,Ph.D., is an academic psychologist with a specialty in the measurement and prediction of human behavior. The communications provided are for informational purposes only and are not intended to be investment advice or recommendations for specific investment decisions. Dr. Kern is not a registered investment advisor, but is registered as a commodity trading advisor (CTA). The information provided is considered accurate, but cannot be guaranteed. Investments/trading in narrow market segments or gold futures is for individuals willing to accept a higher level of risk for the opportunity of greater returns. Past performance is no guarantee of future performance. His website is www.skigoldstocks.com.
Communications should be sent to: jeff@skigoldstocks.com.
Copyright © 2002-2024 Jeffrey Kern. All Rights Reserved.
321gold Ltd

|
