 CHARTWORKS - NOVEMBER 21, 2005 CHARTWORKS - NOVEMBER 21, 2005
Copper - Opportunities
in the Base Metal Sector
Technical observations of RossClark@shaw.ca
Bob Hoye
Institutional Advisors
Nov 23, 2005
Over the past few months, copper
has enjoyed a terrific rally. Indeed, as outlined in the first
chart below, the move since July has been historically remarkable.
A following table places the whole bull market in perspective.
First of all, a cyclical high
was likely to have been set with the general stock market in
the August - September window. It seems that while this is being
accomplished by the stock market, copper soared from 1.50 in
July to 2.10 (Comex prices).
On market dynamics, the chart
is registering the highest MACD in 45 years. Arithmetically speaking,
this is no mean feat and a reversal is inevitable.
COPPER: 1960 - 2005
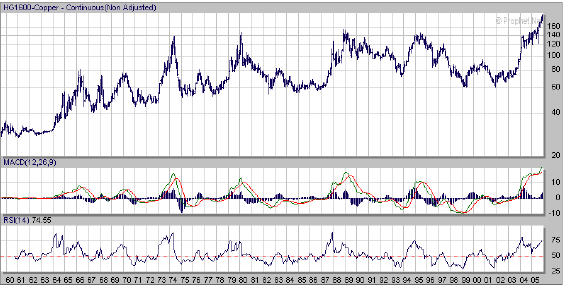
- Note the high on the RSI and
the negative divergence.
- Huge short squeezes are associated
with tops rather than bottoms.
- The Tin Council (think "cartel")
squeezed the shorts in 1985. Tin spiked at 5.93 in June and crashed
to 2.41 in July, 1986.
- This made OPEC (oil cartel)
vulnerable and anticipated the crash in crude from 31.7 at the
end of 1985 to 10.4 in March, 1986.
When?
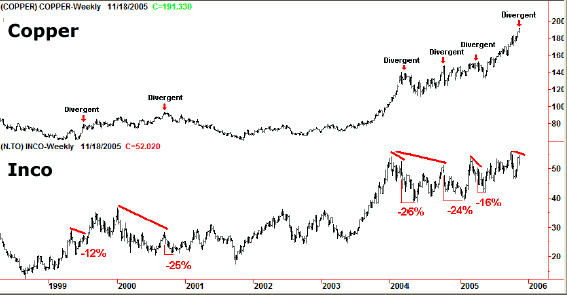
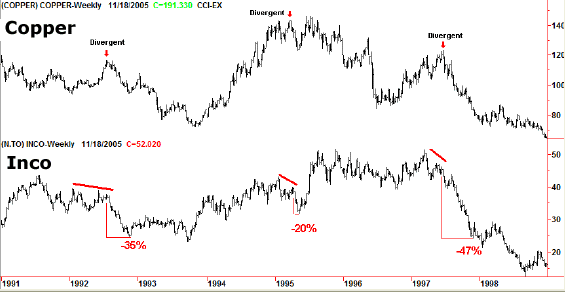
In the following charts, Ross
outlines a "past-due date" for copper based upon the
negative divergence provided by the action in Inco stock. This
connection has been reliable.
OPPORTUNITIES IN BASE METAL STOCKS
( using Inco as the proxy)
Technical observations of RossClark@shaw.ca
Over the years Inco has been
the stock with one of the best correlations to copper prices.
Prices have trended together well and the seasonal break from
March highs through April/May has been present in both, providing
both an exit and re-entry point in the stock.
The current conditions are
presenting what appears to be an important clue to direction
over the coming months. The following two charts display the
weekly price of copper and Inco since 1991. This month's action
has generated the ninth bearish divergence, as copper prices
have moved to new highs unconfirmed by the price of Inco. If
this divergence remains in place and copper rolls over we can
anticipate a fairly significant decline in both items.
Another technique we've previously
utilized for Inco appears appropriate right now. Based upon previous
examples, Inco prices should test or violate the 10% band
below the 55-week moving average (currently CDN$43.50).
1999 to present
 1991 to 1998
OPPORTUNITIES IN COPPER
The recent powerful advance
in copper prices can be attributed to the news of the short squeeze
on the London Metals Exchange. The word around the street is
that the short position for December delivery was built up into
March, but was not covered into the correction during the spring.
Invariably, once the massive Chinese short position in copper
is covered we could very well be left with a vacuum of buyers
and a corrective decline could be quite dramatic. First support
is likely to occur around the 21-week average (currently $1.69).
Following such a break, we would look for another rally into
the seasonal high in March. Such action can produce a series
of opportunities. The producers will likely get hit during a
decline while the consumers will benefit. This could be similar
to the action seen in the energy sector in recent months.
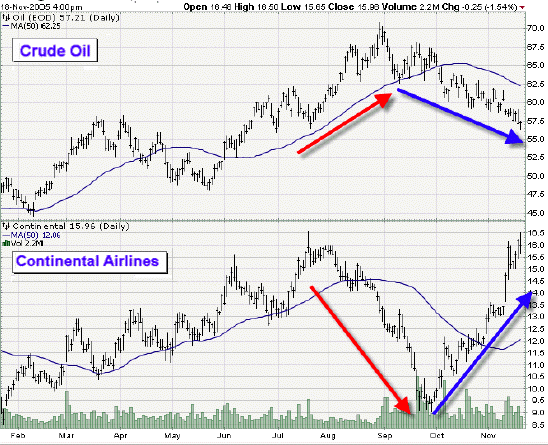
Just think back to August/September
when the greatest fears were over the price of energy and the
effects on the transportation industry, in particular airlines.
Once the oil market rolled over the airlines (CAL example below)
bounced back to life.
HISTORICAL PERSPECTIVE
The era of bubbles that ran
until 1873 had some similarities to today's era of great asset
inflations. One was the fiat dollar.
After increasing for some 20
years, commodity prices became highly speculative. That was in
both price action and intellectual passions.
One of the leading economists
of the day, [William] Stanley Jevons, extrapolated soaring
prices and consumption into a lack of supply that was so serious
that it would severely impair prosperity and would threaten the
existing high standard of civilization.
His book was published in 1865
and was called The Coal Question: An Inquiry Concerning
the Progress of the Nation, and the Probable Exhaustion of Our
Coal-Mines.
One of the salient observations
was "Coal in truth stands not beside but entirely
above all other commodities. It is the material energy of the
country - the universal aid - the factor in everything we do.
With coal almost any feat is possible or easy; without it we
are thrown back into the laborious poverty of early times."
The book also included "This
is a question of almost religious importance," which
view has been repeated in the "Peak Oil" passions of
today.
With this, a great bubble in
stocks and copper blew out in 1873 and The Economist summed it
up with marvelous irony. That's both then and for conditions
today.
"By articles in
newspapers, reviews and magazines all sorts and conditions of
men were induced to interest themselves in copper. It was shown
by figures and arguments, apparently conclusive, and presented
with great ability . . . that the world's [supply] of copper
would be so much reduced that famine prices must prevail. The
confidence in the future was strong enough to cause a further
advance of 25 per cent, which was more than lost in the sequel,
furnishing a fresh illustration of the rapid action of high prices
in these days in bringing forward supplies from every quarter
of the globe."
The subsequent contraction
in highly inflated stock prices was significant.
An index of coal producers
reached 50.6 in August 1873, from which the first bear market
took it down to 23.1 in February, 1879.
After a rebound to 44.8 in
1881, the coal index fell to 12.7 in May, 1885. The low at the
contraction trough was 12.5 in 1897.
Enjoying a bigger party, the
mining and smelting index soared from 99 in January, 1871 (there
was the Franco-Prussian War and the world was going to run out
of copper) to 447 in late 1872. From a high of 419 in 1873, the
mining index declined to 24 (no typo) in 1884.
The low with the depression bottom was 25 in 1897.
CURRENT EXCESSES IN COPPER
In admitting that it is still
difficult to precisely quantify effervescence, it is at least
methodical to make comparisons on a deflated price basis.
The following table provides
the appropriate comparisons on all of the big bull markets on
a database beginning in 1913. Note that the current one has clocked
the biggest gains in over a century.
COPPER
(Deflated By PPI)
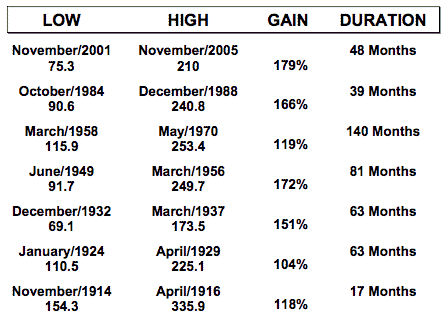 Source: www.thechartstore.com
Clearly, the combination of
both a bubble in industrial commodity prices, a mania in intellectual
speculation, and a specific short squeeze in copper has ramped
copper's real price to an extraordinary level.
This represents equivalent
risk to long positions, both in the metal and in the mining stocks.
Bob Hoye
Institutional Advisors
E-mail bobhoye@institutionaladvisors.com
Website: www.institutionaladvisors.com
CHARTWORKS - NOVEMBER
21, 2005
Hoye Archives
The opinions
in this report are solely those of the author. The information
herein was obtained from various sources; however we do not guarantee
its accuracy or completeness. This research report is prepared
for general circulation and is circulated for general information
only. It does not have regard to the specific investment objectives,
financial situation and the particular needs of any specific person
who may receive this report. Investors should seek financial advice
regarding the appropriateness of investing in any securities or
investment strategies discussed or recommended in this report
and should understand that statements regarding future prospects
may not be realized.
Investors should note that income from such
securities, if any, may fluctuate and that each security's price
or value may rise or fall. Accordingly, investors may receive
back less than originally invested. Past performance is not necessarily
a guide to future performance. Neither the information nor any opinion expressed constitutes
an offer to buy or sell any securities or options or futures contracts.
Foreign currency rates of exchange may adversely affect the value,
price or income of any security or related investment mentioned
in this report. In addition, investors in securities such as ADRs,
whose values are influenced by the currency of the underlying
security, effectively assume currency risk. Moreover, from time to time, members of the Institutional Advisors team may be long or short positions discussed in our publications.
321gold Inc

|
