 CHARTWORKS - NOV 14, 2006 CHARTWORKS - NOV 14, 2006
Gold
Technical observations of RossClark@shaw.ca
Bob Hoye
Institutional Advisors
Posted Nov 16, 2006
Gold support is around $600
over the next few weeks, but need not be tested. This is the
50% corrective support from the October 24th bottom. On the upside,
$775 looks quite attainable for the next leg of the bull market.
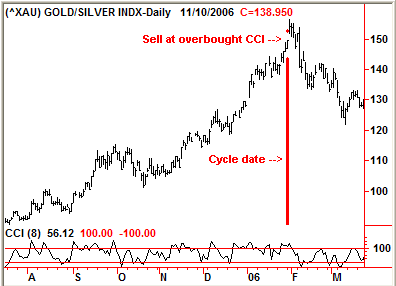
Look for selling pressure after an overbought reading in the
second half of February.
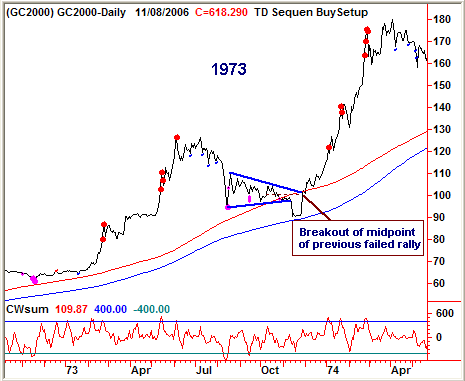
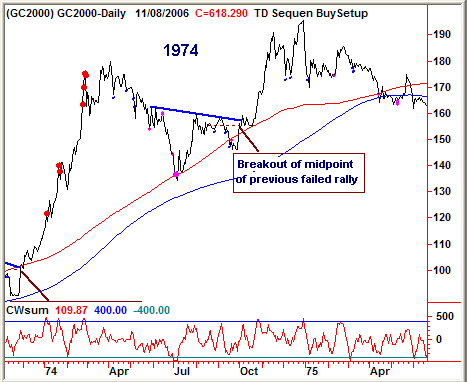
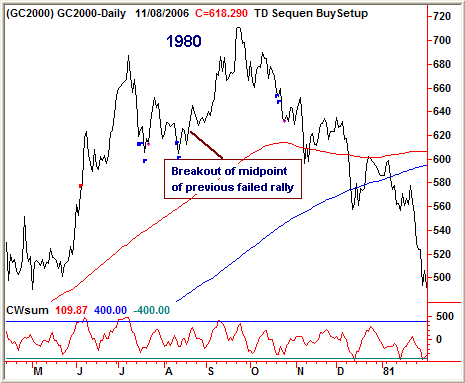
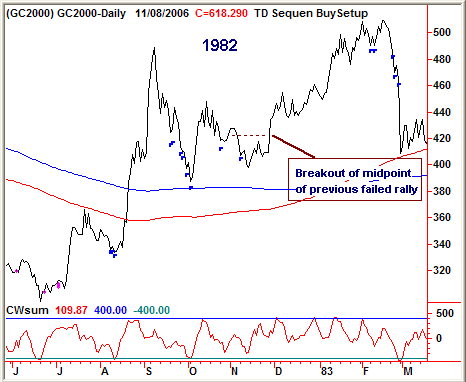
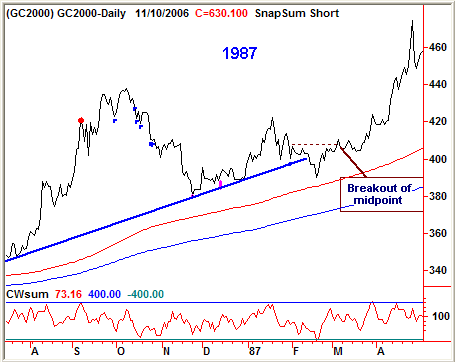
The consolidation pattern since
the break from the May high should be quite familiar to followers
of the gold market. Some of the most noticeable examples occurred
in 1973, 1974, 1980, 1982 and 1987. Each managed to correct 50%
to 60% of an exponential rally (June 14th), then almost
as quickly made back 50% of that break (July 14th), only
to then violate a well established support line but have little
follow through on the downside.
The move into the September
bottom was coincident with an RSI (14) reading of 29. This fit
perfectly with the action following times of conflict (remember
Israel/Hezbollah last summer) as was outlined on July 26th
- - "With the buying power spent, the gold price tends to
ease lower until a resolution in the conflict becomes apparent.
As traders then exit their long positions the market typically
becomes oversold and generates an important low. In most cases
this can be identified with an RSI(14) reading below 32."
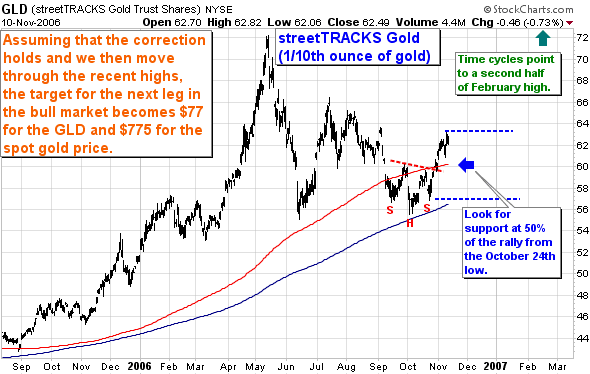
The 'isolated low' of October
4th ($563) was labeled once prices exceeded $588 on October
18th and then confirmed after prices held above that low on October
23rd. This created a six week Head and Shoulders base pattern
that was enough to drive prices higher by the height of the right
shoulder and into the heavy overhead resistance of July and August.
Assuming the support holds over the next few weeks our measured
target is $775.
Previous consolidations patterns of
similar structure
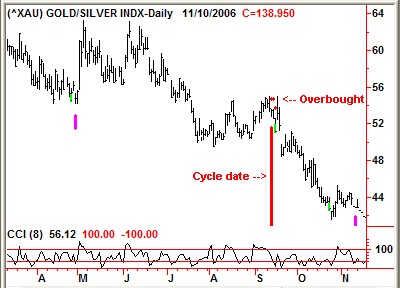
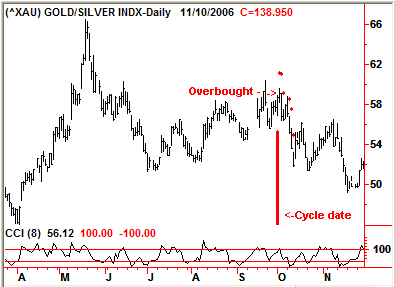
When could the next high appear?
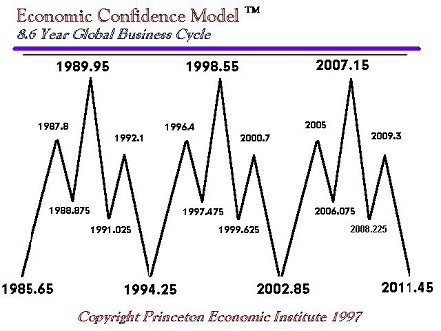
The Economic Confidence Cycle
(8.6 years) and its subsets have been very reliable in the gold
market. We established trading rules in the 1980's that identified
important highs around the date and lows in the weeks following
the cycle date.
In a rising market the cycle
date offers an opportunity to lighten up on long gold related
positions and reestablish them on a hard break. For traders
we will be looking to sell into to mid/late February. Longterm
investors are advised to look for a pullback to add again in
March.
In an uptrend we can expect
the market to become overextended into the cycle date
as seen in 2004 & 2006.
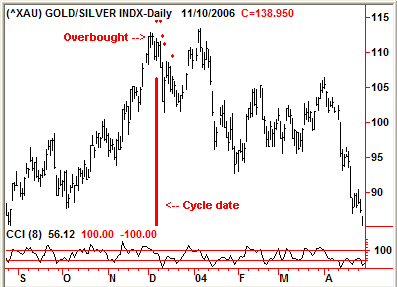
In a flat market with established
overhead resistance the cycle becomes a point to move to the
sidelines
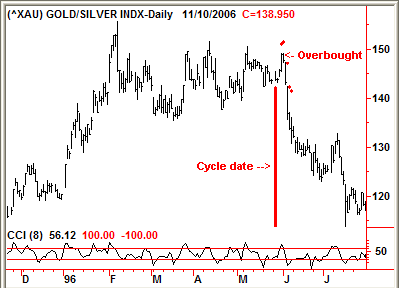
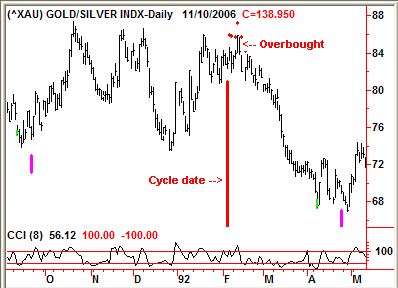
In a downtrend it becomes
a point to add to short positions
-Bob Hoye
Institutional Advisors
email: bobhoye@institutionaladvisors.com
website: www.institutionaladvisors.com
CHARTWORKS #2 - NOV 14, 2006
Hoye Archives
The opinions
in this report are solely those of the author. The information
herein was obtained from various sources; however we do not guarantee
its accuracy or completeness. This research report is prepared
for general circulation and is circulated for general information
only. It does not have regard to the specific investment objectives,
financial situation and the particular needs of any specific person
who may receive this report. Investors should seek financial advice
regarding the appropriateness of investing in any securities or
investment strategies discussed or recommended in this report
and should understand that statements regarding future prospects
may not be realized.
Investors should note that income from such
securities, if any, may fluctuate and that each security's price
or value may rise or fall. Accordingly, investors may receive
back less than originally invested. Past performance is not necessarily
a guide to future performance. Neither the information nor any opinion expressed constitutes
an offer to buy or sell any securities or options or futures contracts.
Foreign currency rates of exchange may adversely affect the value,
price or income of any security or related investment mentioned
in this report. In addition, investors in securities such as ADRs,
whose values are influenced by the currency of the underlying
security, effectively assume currency risk. Moreover, from time to time, members of the Institutional Advisors team may be long or short positions discussed in our publications.
321gold

|
