 CHARTWORKS - OCTOBER 11, 2005 CHARTWORKS - OCTOBER 11, 2005
Gold Short
term risk $460... two-month potential $542
Technical observations of RossClark@shaw.ca
Bob Hoye
Institutional Advisors
posted Oct 14, 2005
The US gold price staged a
triangular consolidation pattern through mid summer. The first
attempt to breakout was thwarted in August as prices retreated
below the breakout ($440) and tested $430. The subsequent rally
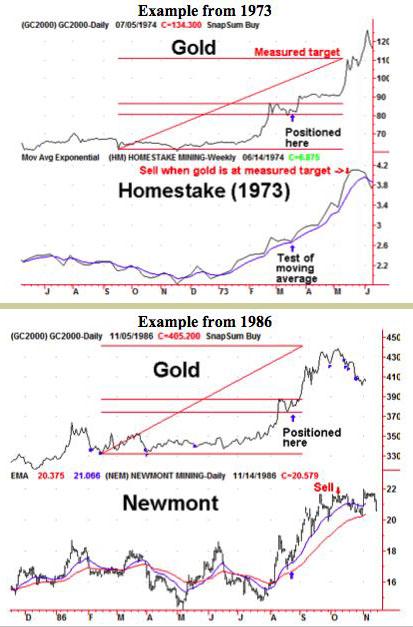
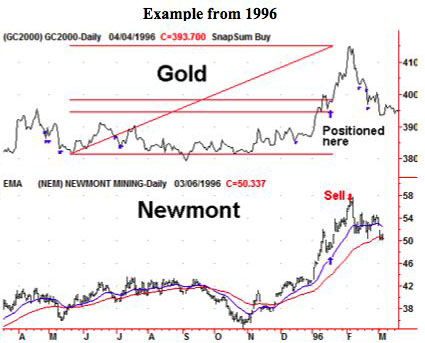
has managed to achieve new multi-year highs. This type of breakout
following a consolidation of seven-months or more has occurred
only once in each of the past three decades. The following charts
display each example together with the pre-eminent gold miner
of the day.
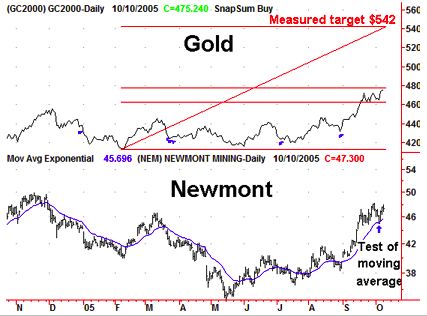
Once the bullion price manages
to make new highs the correction must hold above the old high
(✓) at which time the mining
stock makes a successful kiss of its rising 20-day exponential
moving average (✓). The key
point here is that this pullback to test the breakout in gold
becomes a measuring point for the ensuing rally. Based upon the
previous three examples, from the initial bottom ($412.90, Feb
8th), the current pullback ($463, Sept 23rd) should be at 38%
of the total rally. This calculation provides a target of
$542. While the bullion price may achieve a marginally higher
high, traders should sell the mining stocks once this target
is reached.
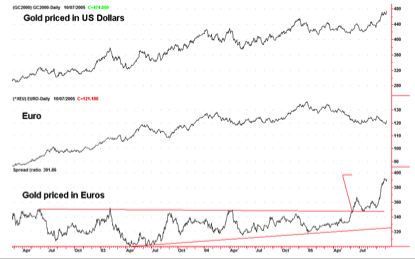
Gold Priced in Various Mediums
The gold trend has been up
for the past month whether it is priced in US Dollars, Euros,
Canadian Dollars, CRB Index, Crude Oil, the Dow Industrials or
S&P. This is the sign of a true bull market.
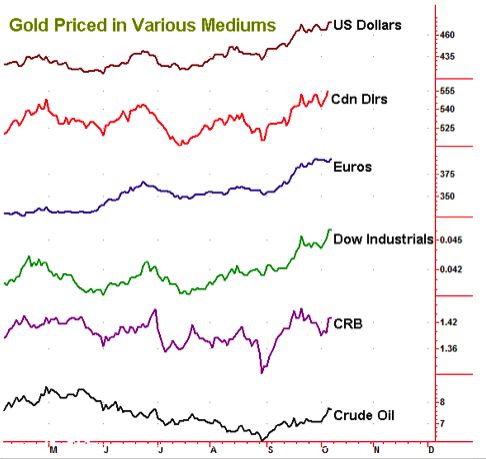
The breakout in the Euro-Gold
price at €350 in June and successful test in July has resulted
in a rally to €394, approaching our minimum target of €400.
The Gold/Crude Oil ratio and
the Gold/CRB ratio are coming off multi-year lows. The following
chart displays the Gold/CRB ratio, Gold in US Dollars and the
RSI of the ratio. Interim highs in the bullion have been concurrent
with RSI readings over 65. Even though this has been an excellent
rally, we are only into a neutral territory with lots of room
before becoming overbought.
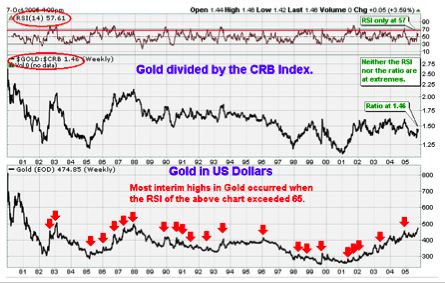
You can also see that since
1987 the Gold/CRB ratio (currently 1.42) has found the 1.60 level
to be a significant support/resistance level. Once again we are
nowhere near that resistance.
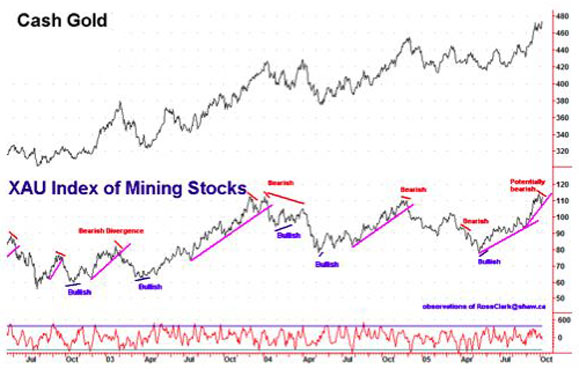
Senior Producers
The XAU and HUI mining stock
indices outperformed the bullion from the bottom in May through
the end of September. However, a bearish divergence has become
evident in the past ten days. If the divergence remains in place
and prices break the support line (currently 108 in the XAU)
a sell signal would be confirmed.
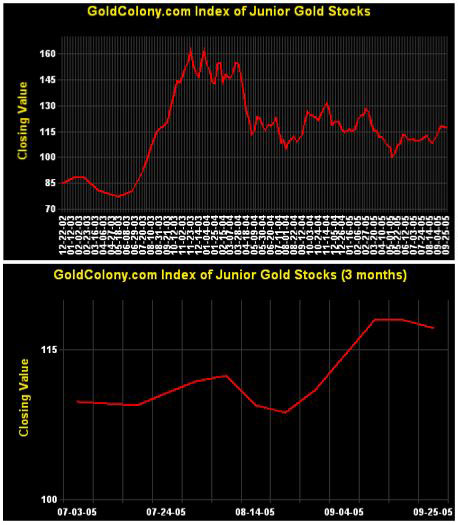
From the following chart you
can see how poorly the juniors have performed in the past 21
months. While they are up 20% since the May bottom they are still
a good 25% off the highs. If gold makes the run to $542 it should
do wonders for this group.
COT
The Commitment of Traders data
is back into dangerous territory once again. The commercials
are short a net 202,724 contracts. The non-commercials are long
a net 171,498 contracts. Both are at extreme levels dating back
to at least 1986. This makes prices vulnerable to any negative
news, but does not guarantee a break. Note that the runs of April
2002-May 2002, December 2002-February 2003, December 2003-January
2004 and October 2004-December 2004 occurred with extreme readings.
The best rallies in any market occur when the open interest is
rising together with the price. Such is the case right now.
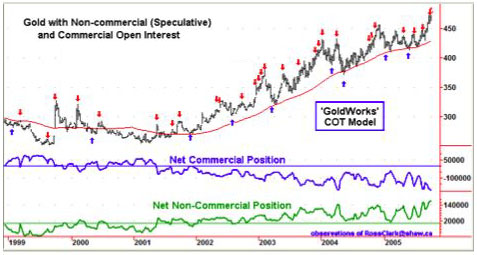
Arrows denote signals from
the GoldWorks COT Model. In non-trending phases or when signals
are in the direction of the underlying trend the market reverses
quickly. However, following upside breakouts from consolidations
it generally takes seven to nine weeks of signals to reverse
the trend.
Bob Hoye
Institutional Advisors
E-mail bobhoye@institutionaladvisors.com
Website: www.institutionaladvisors.com
CHARTWORKS - OCTOBER
11, 2005
Hoye Archives
The opinions
in this report are solely those of the author. The information
herein was obtained from various sources; however we do not guarantee
its accuracy or completeness. This research report is prepared
for general circulation and is circulated for general information
only. It does not have regard to the specific investment objectives,
financial situation and the particular needs of any specific person
who may receive this report. Investors should seek financial advice
regarding the appropriateness of investing in any securities or
investment strategies discussed or recommended in this report
and should understand that statements regarding future prospects
may not be realized.
Investors should note that income from such
securities, if any, may fluctuate and that each security's price
or value may rise or fall. Accordingly, investors may receive
back less than originally invested. Past performance is not necessarily
a guide to future performance. Neither the information nor any opinion expressed constitutes
an offer to buy or sell any securities or options or futures contracts.
Foreign currency rates of exchange may adversely affect the value,
price or income of any security or related investment mentioned
in this report. In addition, investors in securities such as ADRs,
whose values are influenced by the currency of the underlying
security, effectively assume currency risk. Moreover, from time to time, members of the Institutional Advisors team may be long or short positions discussed in our publications.
321gold Inc

|
