 CHARTWORKS
- SEP 9, 2009 CHARTWORKS
- SEP 9, 2009
Silver – Technical Perspective
Technical observations of RossClark@shaw.ca
Bob Hoye
Institutional Advisors
Sep 12, 2009
There are many means of analyzing silver from a technical perspective. Simple charting with oscillators, moving averages and cycles can help for short term work, but measuring its performance against Gold, mining stocks or the CPI brings greater value to assessing the bigger picture.
Short-term:
Precious metal’s price action has a close relationship with the movement of the currencies. This week’s upside movement in the Euro puts it into a sequential sell setup mode for the first time since April 2008 and nineteenth since 1989. Based upon previous signals, this implies that silver and gold should see short-term highs within two weeks. Once the currencies have corrected to their 20-week moving averages the timing would be appropriate for new purchases.
Intermediate term:
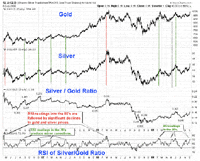
Mining stocks are outperforming silver. Silver is outperforming gold.
(Click on images to enlarge)

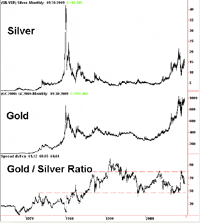
The performance of silver relative to gold has been an important and reliable indicator through the previous transitions from a financial mania to a post-bubble contraction. During the boom the gold/silver ratio declines and during the bust it rises. In severe liquidity crises silver has plunged relative to gold. This was the case with the latest crash when the ratio increased to 84. Then, with the usual rebound following financial disaster, the ratio has been expected to decline, and so far the low has been this week's 61.

In addition to watching the absolute level of the GSR the Relative Strength Index of the ratio has been a valuable means of analysis. When the metals are in an uptrend the RSI(14) of the Silver/Gold ratio will generally become overbought and lead the top by as much as two weeks. An RSI(14) reading into the 80’s (1974, 1979, 1980, 1987, 1988, 2003, 2004, 2006 & 2008) is indicative of a major top in the making with subsequent declines in silver of 25% or more. Declines of 12% to 15% are common when the RSI(14) tops around 70.
Once other technical measurements become excessive we will use this analysis to assist in determining the depth of the break.

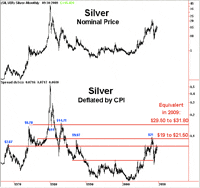
Today’s silver price (around $16), when adjusted for CPI, is the equivalent of the $2.67 high in 1968. As can be seen on the following chart of the deflated price this level also provided support in 1976-78 and resistance in 2006-2007. Other key levels to be watching for resistance are:
- $19 to $21.50; the equivalent of the 1987 and 2008 highs.
- $29.50 to $31.80; the equivalent of the 1974 & 1983 highs and the 1980 low. This would be exceptional.

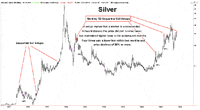
Another long term view of the price shows the six monthly Sequential Sell Setups of the past fifty years. If September manages to finish above $15.73 then the seventh setup will be in place. However, being overbought does not mean that prices must reverse. The September ’72 and May ’78 occurrences were followed by the largest percentage gains of the data series. The most obvious difference was the ability to continue putting in higher lows in the subsequent months. The four other times saw a lower low in the first or second month. Price declines were then in the magnitude of 34% to 44% within the next year. For now $14.65 is the critical level to watch.

For details of the Sequential pattern refer to The New Science of Technical Analysis by Tom Demark.
Sep 9, 2009
-Bob Hoye
Institutional Advisors
email: bobhoye@institutionaladvisors.com
website: www.institutionaladvisors.com
Hoye Archives
The opinions
in this report are solely those of the author. The information
herein was obtained from various sources; however we do not guarantee
its accuracy or completeness. This research report is prepared
for general circulation and is circulated for general information
only. It does not have regard to the specific investment objectives,
financial situation and the particular needs of any specific person
who may receive this report. Investors should seek financial advice
regarding the appropriateness of investing in any securities or
investment strategies discussed or recommended in this report
and should understand that statements regarding future prospects
may not be realized.
Investors should note that income from such
securities, if any, may fluctuate and that each security's price
or value may rise or fall. Accordingly, investors may receive
back less than originally invested. Past performance is not necessarily
a guide to future performance. Neither the information nor any opinion expressed constitutes
an offer to buy or sell any securities or options or futures contracts.
Foreign currency rates of exchange may adversely affect the value,
price or income of any security or related investment mentioned
in this report. In addition, investors in securities such as ADRs,
whose values are influenced by the currency of the underlying
security, effectively assume currency risk. Moreover, from time to time, members of the Institutional Advisors team may be long or short positions discussed in our publications.
321gold Ltd

|