|
|||
|
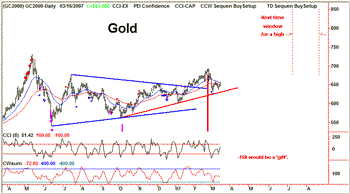
| The decline from $692 to $635 has likely put in the bottom of the correction in gold bullion. While the basing/consolidation phase could carry into mid April the next move of significance is expected to take out last May's high of $735 by a significant amount. Timing models now point to late July through mid August for the next interim high. |

The January 23rd breakout of the symmetrical triangle in gold created a minimal rally and by February 3rd we lowered our expectations on the upside potential for the second leg of the rally; however the timing for a high remained unchanged, looking for an overbought CCI(8) reading around February 26th √. The divergence with the mining stocks and the high COT numbers made the likelihood of a correction imminent √.
The 8% break has likely established a lasting interim low, and now gold is in a position to push through to a multi-year high. The COT numbers show that the net speculative long position has declined by 46k to 96k while the commercial shorts are down by 53k to 131k. The price has retraced to the breakout line from the triangle and successfully tested it on March 14th.
The worldwide selling of most liquid investments following the peak of the 8.6 year Economic Confidence Cycle surrounding the weekend of February 23rd to 26th included gold. While most analysts anticipate all safe haven investments to rise at times such as this, gold has a history of creating a short lived peak on panic buying and then getting hit badly. This time was no different.

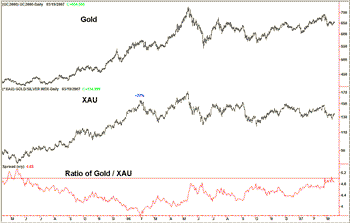
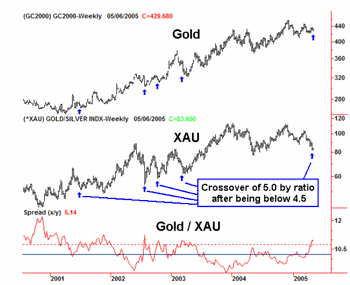
In May '05 we expanded upon the work of Dr. John Hussman examining the ratio of Gold to the XAU (see below). Basically, when the ratio moves above 5 the mining stocks are deemed to be undervalued and have a history of doing well over the coming months. In the eight months following the last alert in 2005 the XAU rallied 77%. As of March 13th the ratio was 5.05 (the first time above 5 since May 23, 2005). This helps corroborate our conclusion that the next significant move in the sector will be to the upside.
Mining stocks have unperformed bullion since January 2006. While we think the latest interim low for gold is now in, there is a 50:50 possibility there is one more decline to test the gold low that could potentially allow shares in some miners to make an 'undercut' low relative to their recent March 2007 lows.
For those who want to play for another test of the lows, if one more decline brings the CCI(8) below - 150 then gold and mining stocks become a gift . . . OR if the CCI(8) only declines below -100 and then reverses back above -100 after March 26th it will be time to enter.
| We had been recommending that investors scale back to a core position in precious metals until the expected March/April correction ran its course. There is a possibility that this correction could last a bit longer, but is has accomplished all we were looking for already, and we want to remind investors that our expectation has always been for new highs to result from this correction. Timing wise, the April 9th to 23rd window mentioned recently continues to look like the launching pad for the next big move. We look for the stocks to play catch-up from mid-April into the summer as bullion makes new highs. |
Rudimentary
Evaluation Model
Gold/XAU
May 3, 2005
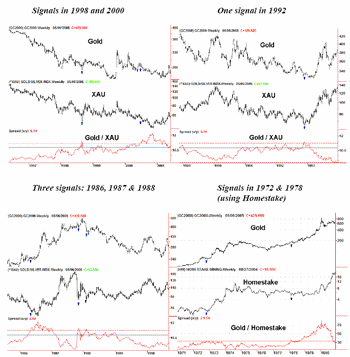
Dr. John Hussman of the Hussman Funds is reported to have presented an excellent analysis of the XAU as related to the gold price. Having only read a few quoted paragraphs I put together the following charts. The twelve times the ratio crossed over 5.0 after having been below 4.50 are noted with arrows. In ten instances the XAU was at a good valuation point and staged an excellent rally starting within weeks. In 1986 the XAU took twelve weeks to bottom out (dropping 11.5%), but was 197% higher within a year. The only poor signal occurred in 2000.
When combining this valuation model with my recent analysis it would appear that an upside reversal in the sector should not be too far around the corner.


-Bob Hoye
Institutional Advisors
email: bobhoye@institutionaladvisors.com
website: www.institutionaladvisors.com
CHARTWORKS - MARCH 20, 2007
Hoye Archives
The opinions
in this report are solely those of the author. The information
herein was obtained from various sources; however we do not guarantee
its accuracy or completeness. This research report is prepared
for general circulation and is circulated for general information
only. It does not have regard to the specific investment objectives,
financial situation and the particular needs of any specific person
who may receive this report. Investors should seek financial advice
regarding the appropriateness of investing in any securities or
investment strategies discussed or recommended in this report
and should understand that statements regarding future prospects
may not be realized.
Investors should note that income from such
securities, if any, may fluctuate and that each security's price
or value may rise or fall. Accordingly, investors may receive
back less than originally invested. Past performance is not necessarily
a guide to future performance. Neither the information nor any opinion expressed constitutes
an offer to buy or sell any securities or options or futures contracts.
Foreign currency rates of exchange may adversely affect the value,
price or income of any security or related investment mentioned
in this report. In addition, investors in securities such as ADRs,
whose values are influenced by the currency of the underlying
security, effectively assume currency risk. Moreover, from time to time, members of the Institutional Advisors team may be long or short positions discussed in our publications.

