|
|||||||||||||||||||||||||||||
|
|||||||||||||||||||||||||||||
|
Technical measurements continue to point to $775 for the next leg of gold's bull market while stock gold indices have targets 27% to 32% above current levels. An interim high should be anticipated in February. For traders, risk should be controlled below the lows of the past two weeks. Related mutual funds (i.e. Sprott Gold and Precious Metals Fund, Sentry Select Precious Metals Growth Fund, etc.), the Exchange Traded Funds (GDX & XGD.TO) or options on the indices can provide a diversified means of investing in the sector. |
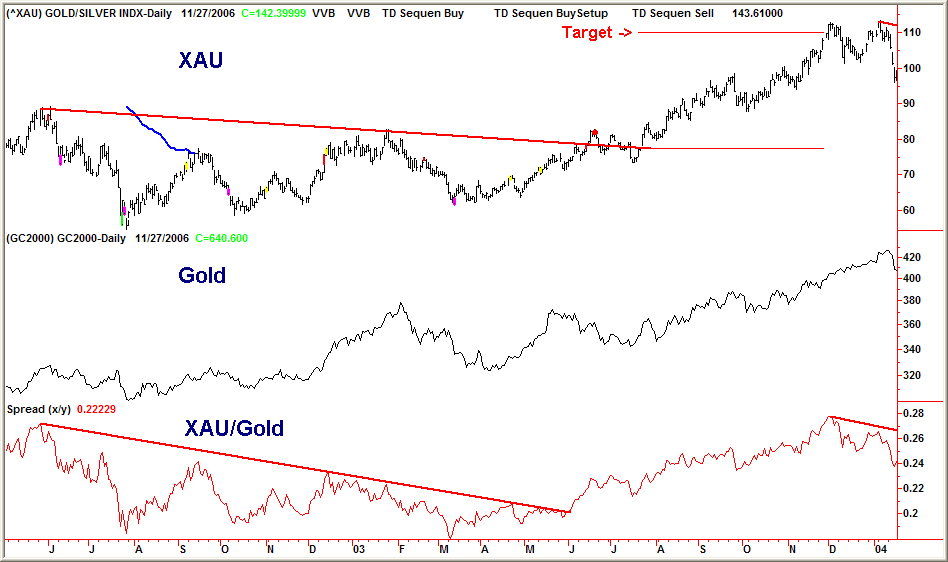
The drop in the XAU/Gold ratio into November created an important setup. The advance from October 3rd was more than 0.01 and the decline into November 20th made a higher low. On December 4th the ratio reversed up through the resistance of 0.228 of October 25th. Gold prices generally setback for six to thirteen trading days following the breakout and this now appears as in place as of December 18th (10 trading days).
|
Update of October 29 review: XAU vs Gold (Homestake used for analysis purposes prior to 1982). For the past thirty-five years we have seen the beginning of most of the important gold rallies lead by strength in the mining stocks. This only makes sense, because of the leverage factor available in the earnings potential of commodity based companies. In the biggest rally (1971 to 1974) gold prices rose by 39% per annum. During that period there were six instances where the ratio of Homestake/Gold made a significant pullback (greater than 0.01) to a higher low and then broke out to the upside. Each breakout coincided with the beginning of an upward move in gold prices. In the 1976 to 1980 rally (annualized advance of 35%) there were five such timely 'breakouts'. The 2001 to 2006 rally (annualized advance of 14%) has seen seven 'breakouts', the last one being December 15, 2005. |
Red arrows on the following chart identify the last two major signals. Blue arrows identify short term signals.

The most recent COT data showed a decline in the net speculative long position and commercial short positions by over 11,000 contracts. At 69,893 contracts the speculative positions are still 60k below the levels seen last spring. We should have little need for concern until the positions grow well beyond 110k and produce an RSI reading over 60. (The current RSI reading of 41 is close to generating a new buy signal).

The action in the mining indices (XAU, HUI, GDM & XGD.TO) is on the verge of completing a well defined base. There are many ingredients that correlate with previous bases (see next page) and make it possible to establish guidelines as we move forward. The similarities:
- An A-B-C decline into June
- Followed by a rally back to the volatility band coupled with an RSI(14) reading in the mid 60's during July
- Then a series of re-tests of the July resistance
- An almost vertical drop to test support in October
- A rally back to the resistance line (from the closes of May 10th & September 5th)
- A move above 0.23 in the XAU/Gold ratio (through its resistance level) confirming leadership in the stocks. Then a 10 day correction in gold (normally 6 to 13 trading days from the breakout in the ratio).
- A re-test of the breakout line (December 21st) taking the accepted three weeks that was noted in the commentary of November 28th.

What to watch for as we move ahead:
- A breakout in gold of the December highs and the 89-day standard deviation band (currently $667)
- A measured move in the stock indices that is equal to the depth of the consolidation pattern.
|
|
||
| Index | Current level | Target |
|
|
|
|
|
|
|
|
|
|
|
|
|
|
|
|
|
|
|
|
click on images to enlarge charts
1992-1993 |
2003-2004 |
2001 |
2002-2003 |
Pi Cycle
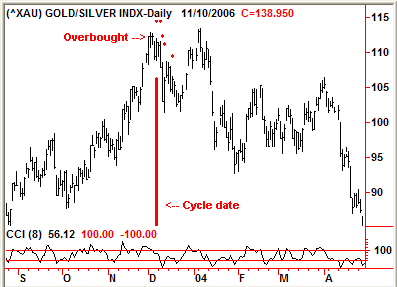
We are approaching a Pi cycle date of February 27, 2007. Pi times 1,000 (3,142 days) and its 1/8th subsets have been very reliable turning points in the gold market. We established trading rules in the 1980's that identified important highs around the date and lows in the weeks following the cycle date.
In a rising market the cycle date offers an opportunity to lighten up on long gold related positions and reestablish them on a hard break. For traders we will be looking to sell into to mid/late February. Longterm investors are advised to look for a pullback to add again in March/April.

The stocks generally top first. We've found that a daily CCI(8) reading over 90 in the XAU within 10 trading days of the Pi date has been an optimum signal to lighten up on the mining stocks. If the XAU is unable to generate an overbought reading within that time window then a trailing stop should be used to exit longs.
The optimum re-entry for mining stocks and bullion occurs once the CCI(8) becomes oversold in gold following the Pi cycle:
After 8 trading days; buy any reading under -150
After 15 days; add a buy-stop above a trailing 20-day high
If no signal by the 20th day then add an additional criteria; buy on a CCI(8) crossover of -100
Using these rules the XAU has produced declines (re-entry opportunities) of 12%, 13%, 10%, 12%, 20%, 10%, 13% and 8% in recent years.
###
-Bob Hoye
Institutional Advisors
email: bobhoye@institutionaladvisors.com
website: www.institutionaladvisors.com
CHARTWORKS #2 - JANUARY 2, 2007
Hoye Archives
The opinions
in this report are solely those of the author. The information
herein was obtained from various sources; however we do not guarantee
its accuracy or completeness. This research report is prepared
for general circulation and is circulated for general information
only. It does not have regard to the specific investment objectives,
financial situation and the particular needs of any specific person
who may receive this report. Investors should seek financial advice
regarding the appropriateness of investing in any securities or
investment strategies discussed or recommended in this report
and should understand that statements regarding future prospects
may not be realized.
Investors should note that income from such
securities, if any, may fluctuate and that each security's price
or value may rise or fall. Accordingly, investors may receive
back less than originally invested. Past performance is not necessarily
a guide to future performance. Neither the information nor any opinion expressed constitutes
an offer to buy or sell any securities or options or futures contracts.
Foreign currency rates of exchange may adversely affect the value,
price or income of any security or related investment mentioned
in this report. In addition, investors in securities such as ADRs,
whose values are influenced by the currency of the underlying
security, effectively assume currency risk. Moreover, from time to time, members of the Institutional Advisors team may be long or short positions discussed in our publications.


