|
|||
How to Find Opportunities from Blood, Debt & FearsBy Frank Holmes
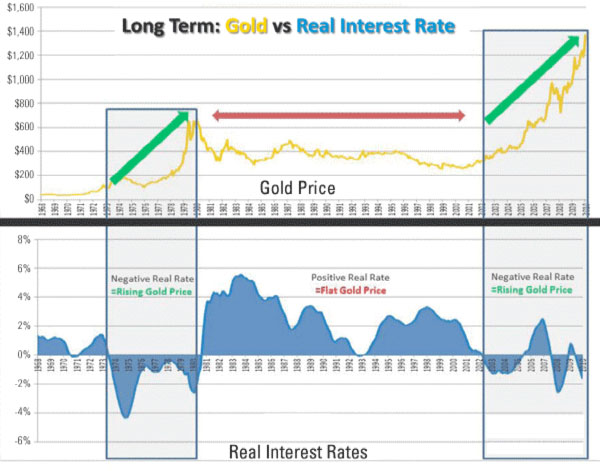
A family who takes in an annual income of $21,700 but spends $38,200 will soon be in dire straights. The large outstanding balance on the credit card only exacerbates the situation. Clearly, spending cuts need to be made, but eliminating only $385 from the family’s budget would be a drop in the bucket. Either a substantially higher amount of income needs to be made, or the family will have to learn to live with less. Of course, the fiscal situation is more complicated when it comes to a “family” of 311 million. It is only one part of a large conundrum for the global economy. Gold is “Sole Beneficiary” in this Economy Don Coxe, global portfolio strategist, points to the Shanghai Composite Index and Bombay Sensex which are currently at one-year lows, indicating that investors are not feeling confident even in these relatively strong markets where GDP is growing. In this environment, Coxe believes gold is the “sole beneficiary.” We’ve discussed several times that another driver of gold prices has been real interest rates. Take a look at the chart from Gold Stock Analyst (GSA) depicting the price of gold going back to 1968. In each case when real rates (calculated by subtracted the 12-month moving average of the year-over-year change of CPI from the 12-month moving average of the 3-month Treasury bill) went negative - in the 1970s, the first years of the new decade, and off and on from 2008 until now - gold has had a dramatic rise in price. A negative real interest rate means that a hypothetical $100 investment in a T-bill is worth, for example, $98.90 a year later, i.e. you’ve lost purchasing power. Investors seeking yield have fled to gold in these instances.
Conversely, when interest rates turned positive in the 1980s, gold trended downward for the next 20 years. Despite gold’s dramatic bull run over the last 10 years, the yellow metal is only twice as high as its 1980 price. In comparison to other economic yardsticks since 1980, this is miniscule. Ian McAvity, editor of Deliberations on World Markets, says that federal debt, the S&P 500 Index and even GDP has grown much faster than gold over that same timeframe.
The gross U.S. federal debt of $14.3 trillion is 17 times its 1980 level. In 1980, the S&P 500 was at 105; today, it trades around 1,100. A gold price of $1,808 seems paltry as it is only 2.5 times the 1980 high of $738. McAvity extrapolates the relative growth rate of the yellow metal, indicating that if gold doubled from its current high, it “would nearly ‘catch up’ to GDP, while it might take a quadruple to match the S&P, or even a six-fold gain from here to catch the growth of debt.” Multiplying the largest of these figures by the current price of gold means prices could theoretically go to $10,800. By these standards, gold is hardly a bubble. Gold these days has become so “legitimized,” helped by negative real interest rates, that the metal now directly competes with stocks for a share of investors’ portfolios, says the GSA. We applaud this development, as we have always thought investors should allocate a small portion of their portfolio to gold. However, we argue that a gold ETF is not always a wise choice, particularly when it is treated as a short-term trade, like a stock. As we’ve indicated many times in recent months, a better opportunity for gold investors appears to be in gold mining companies. Coxe agrees, as he believes today represents the “greatest devaluation of precious metal stocks.” In his experience, he thinks there has never been such a disparity in precious metals stocks compared to the price of gold. There are two reasons for this: In the 1970s, the gold ETF did not exist, so speculators who wanted gold exposure had to purchase bullion and take physical possession of it or purchase gold mining shares. Also, gold miners have faced higher labor and energy costs as well as increased capital expenditures. Coxe also brought to our attention the Investor’s Business Daily’s Industry Sub-Group Rankings, which lists six-month performance to help investors identify potential growing areas of the economy. Out of 197 groups, the third-ranking member on the list was gold mining companies. Over the last several weeks, gold has received a lot of attention and we’ve discussed gold stocks and gold bullion quite often. If you were out trying to squeeze in one last summer vacation, here’s what you missed:
Two Recent Developments for U.S. Stocks What hasn’t gotten a lot of attention in the media is growing money supply. Instead, much of the media has focused on day-to-day, even hour-to-hour, data. However, it is a key lubricant of the economy and financial markets. The Federal Reserve influences money supply growth, and as can be seen in the chart below, money supply often spikes during crisis or uncertainty, such as Y2K, 9/11, the collapse of Lehman Brothers and the ensuing financial crisis. The current environment of sluggish growth, government austerity and worries over the European banking sector has likely influenced the dramatic rise in money supply over the past 18 months. The Fed likely errs on the side of caution to stimulate growth as inflation is not currently a concern.
Generally speaking, if money is growing faster than nominal GDP, that excess money tends to find its way to other uses such as investment in stocks, commodities and other financial assets. The relationship between money supply and financial assets is nonlinear and changes over time, but when tallying up pros and cons for the current environment, the recent increase of more than 8 percent in money supply growth provides a tailwind for commodities and stocks. Equities look particularly attractive relative to bonds, especially today. During the last 40 years, the yield on the S&P 500 has rarely exceeded the yield on the 10-year Treasury bond.
For the long-term investor, the risk/reward profile for owning stocks appears positively skewed. Equity investors have suffered through one of the most difficult decades - rivaling even the Great Depression - while bond investors have enjoyed a 30-year bull market. Long-term mean reversion is a powerful tool that investors can use to help them attain their long-term goals. It’s worth repeating the famous quote from Baron Rothschild, an 18th century British nobleman and member of the Rothschild banking family, who is credited with saying that "the time to buy is when there's blood in the streets." It has been “bloody” recently and that is precisely the time to have the courage to make long-term investments at favorable prices. John Derrick, Director of Research, contributed to this article.
Want to receive commentary from Frank and analysis from the rest of the U.S. Global Investors team delivered to your inbox every Friday? Sign up to receive our weekly Investor Alert at www.usfunds.com. U.S. Global Investors, Inc. is an investment management firm specializing in gold, natural resources, emerging markets and global infrastructure opportunities around the world. The company, headquartered in San Antonio, Texas, manages 13 no-load mutual funds in the U.S. Global Investors fund family, as well as funds for international clients. All opinions expressed and data provided are subject to change without notice. Some of these opinions may not be appropriate to every investor. The S&P 500 Stock Index is a widely recognized capitalization-weighted index of 500 common stock prices in U.S. companies. The Shanghai Composite Index (SSE) is an index of all stocks that trade on the Shanghai Stock Exchange. The Bombay Stock Exchange Sensitive Index (Sensex) is a cap-weighted index. The selection of the index members has been made on the basis of liquidity, depth, and floating-stock-adjustment depth and industry representation. Sensex has a base date and value of 100 on 1978-1979. The index uses free float. 321gold Ltd |