| |||
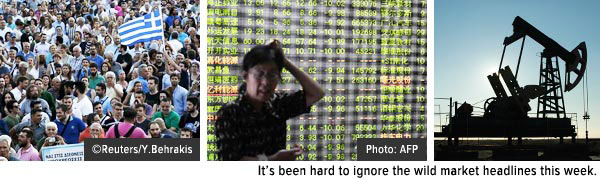
Global Investors: You Should Be Paying Attention to this Economic IndicatorBy Frank Holmes Reality set in for investors last week: Tremors are shaking up the global markets. A “no” vote from the Greek referendum last Sunday, the vast stock market selloff in China, and the volatile movements in the price of U.S. crude oil have made it clear the worldwide economy is collectively riding the brakes. The 3.5-hour halt in trading on the NYSE also added to investors’ unease.
Last week on BNN TV, Canada’s leading business station, I explained that an important forward-looking economic indicator we closely monitor at U.S. Global Investors can help make sense of this slowdown: the global manufacturing purchasing managers’ index (PMI), which we've written about many times. Coupled with this, our portfolio managers recognize that during highly volatile markets adjusting cash levels in our funds is key. In addition to our own macro models, BCA Research, a highly respected independent research company, pointed out that PMIs in developing economies have plunged to new lows. The International Monetary Fund also revised downward its global growth forecast for 2015. On this account, bad news is good news, as central bankers are scrambling to stimulate economic growth. (Click on images to enlarge) As active managers, we have raised our cash levels looking for opportunities in a sloppy market, particularly in our China Region Fund (USCOX). This allows us to mitigate risk and deploy that cash when stocks look attractive per our model, which focuses on factors like high returns on invested capital, sales per share growth and dividend per share growth. The Trend is Your Friend It’s common for investors to look at gross domestic product (GDP) when making decisions about how to deploy capital. Unlike GDP, which looks back or in the rearview mirror, PMI is forward-looking. PMI gathers data such as global output, new orders, exports, prices and employment, making it a reliable indicator for both commodity performance and business activity. ISM, or Manufacturing Institute for Supply Management, is the U.S.-specific calculation of PMI. Take a look at global PMI. It has continued on a three-month downtrend for the month of June. Similarly, PMI in the U.S. peaked seven months ago but has since been modestly declining. The threat of rising rates has been a contributing factor, and although Federal Reserve Chairwoman Janet Yellen stated Friday that the U.S. is on track to raise rates in September, many agree that this date is too soon. Card Counting: Using the PMI Pattern to Your Investing Advantage Understanding PMI is one way investors can use patterns to improve their chances of positive returns in the market – just like card counting in a game of Blackjack. When looking at PMIs, a reading of 50 or above indicates manufacturing expansion, while a reading below 50 indicates a slowing economy. PMIs for individual countries like China and Greece are negative right now, meaning that manufacturing activity is contracting. Our investment team’s research has shown that when the one-month reading crossed below the three-month trend, there was a significant probability that materials, energy and commodities would fall six months later. Conversely, when it crossed above, manufacturing activity would ramp up, which greatly improved the performance of commodities such as copper and crude oil, along with the materials and energy sectors. The Great Shift in Seasonal Oil As I explain in our Managing Expectations whitepaper, using seasonal patterns, along with global PMI, is another way to understand trends in the market and the world at large. Historically, the hurricane season in August/September has shut down the supply of oil offshore, leading to a peak in relative price around this time. But as you can see in the chart below, the new technology of fracking and a corresponding increase of U.S. onshore production, have led to a surplus, drastically shifting the shorter-term seasonal pattern in oil. Staying Nimble During Changing Landscapes Professor of Mathematics at the University of Oxford, Marcus du Sautoy, said it best: “Although the world looks messy and chaotic, if you translate it into the world of numbers and shapes, patterns emerge and you start to understand why things are the way they are.” The global markets right now indeed appear “messy and chaotic,” but curious investors and fund managers realize that specific tools and patterns help them navigate through the complexity and intensity of constantly changing landscapes. In fact, it is the agile active management and the use of these investment tools that landed two of our funds in Investor’s Business Daily’s “Weekly Review” section last week. This particular section of IBD is a screened list of top-rated stocks for the week, along with the top-performing funds that own these particular stocks. Our Holmes Macro Trends Fund (MEGAX) and Global Resources Fund (PSPFX) are recognized for owning nine of these top stocks. Subscribing to our award-winning Investor Alert newsletter is one way investors can stay on top of geopolitical and economic events that could affect their investments. We’d really appreciate it if you’d share our publication with your friends and colleagues!
### Please consider carefully a fund’s investment objectives, risks, charges and expenses. For this and other important information, obtain a fund prospectus by visiting www.usfunds.com or by calling 1-800-US-FUNDS (1-800-873-8637). Read it carefully before investing. Distributed by U.S. Global Brokerage, Inc. Past performance does not guarantee future results. Foreign and emerging market investing involves special risks such as currency fluctuation and less public disclosure, as well as economic and political risk. By investing in a specific geographic region, a regional fund’s returns and share price may be more volatile than those of a less concentrated portfolio. Because the Global Resources Fund concentrates its investments in specific industries, the fund may be subject to greater risks and fluctuations than a portfolio representing a broader range of industries. Stock markets can be volatile and share prices can fluctuate in response to sector-related and other risks as described in the fund prospectus. The Purchasing Manager’s Index is an indicator of the economic health of the manufacturing sector. The PMI index is based on five major indicators: new orders, inventory levels, production, supplier deliveries and the employment environment. The S&P 500 Energy Index is a capitalization-weighted index that tracks the companies in the energy sector as a subset of the S&P 500. The S&P 500 Materials Index is a capitalization-weighted index that tracks the companies in the material sector as a subset of the S&P 500. All opinions expressed and data provided are subject to change without notice. Some of these opinions may not be appropriate to every investor. By clicking the link(s) above, you will be directed to a third-party website(s). U.S. Global Investors does not endorse all information supplied by this/these website(s) and is not responsible for its/their content. 321gold Ltd |