|
||||||||||||
|

 Generally speaking,
the greater the volatility of a given security, the higher its
risk for the investor. And the greater the risk you're willing
to take, the greater the potential profits you could reap. So
taking the comparison to its logical conclusion, the greater
the volatility, the greater the potential profits and, of course,
the greater the potential losses.
Generally speaking,
the greater the volatility of a given security, the higher its
risk for the investor. And the greater the risk you're willing
to take, the greater the potential profits you could reap. So
taking the comparison to its logical conclusion, the greater
the volatility, the greater the potential profits and, of course,
the greater the potential losses.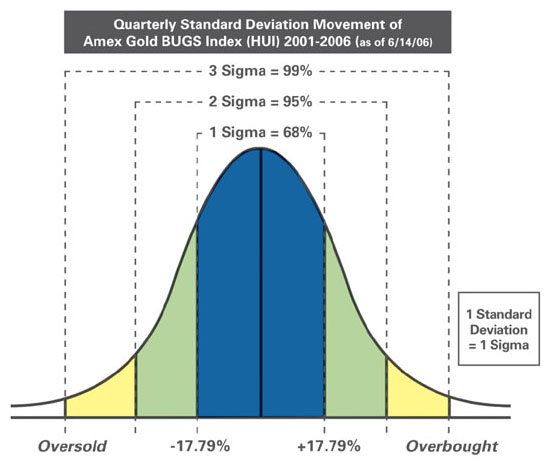
| Index | Weekly | Monthly | Quarterly |
| HUI | 4.77% | 9.96% | 17.79% |
| S&P 500 | 2.05% | 4.18% | 6.89% |
**Sigma is the Greek notation for standard deviation. Normally distributed random data series fall within +1 sigma from the mean around 68% of the time.
Over the last five years as of 6/14/06, the HUI has had a quarterly sigma of 17.79 percent. That means if you marked each quarterly return for the last five years on a graph, you could expect 68 percent of those marks to be within 17.79 percent above or below the average (mean) return. Ninety-five percent of those marks would predictably fall within 35.58 percent above or below the mean return because that's two sigma.
A gain of 10 percent in a quarter might sound exceptional for an investment, but for the HUI, that level of return falls within the range of normal over the past five years. Likewise, a quarterly drop of 10 percent can sound scary, but if you know the sigma for the HUI, you know that too is within its normal movement.
When is an index overbought
or oversold?
Quarterly Standard
Deviation Movement of the HUI - 2001-2006 as of 6/14/06
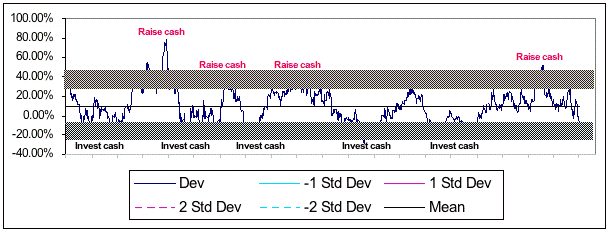
You should pay closer attention when returns fall outside one sigma during a specific time period, whether that variance is positive or negative. If an index's performance rises more than one sigma, it could signal that it is overbought, so you might consider selling or holding off on buying. That's because, statistically, there is only a 16 percent chance that it will go higher. The mechanics are reversed when a performance drops more than one sigma. In that case, it suggests the index's stocks may be oversold, so you might consider buying or not selling because the chance of further loss is only 16 percent.
Volatility eases over time.
Again, look at the sigma over the weekly, monthly and quarterly time periods for the HUI. You can see that the volatility is not linear. For instance, the HUI has a weekly sigma of 4.77 percent, so one might think that the monthly sigma should be four times higher because there are four weeks in a month. But in reality, the monthly sigma of 9.96 percent is a little more than double the weekly figure. Likewise there are three months in a quarter, but the quarterly sigma was less than double the monthly number.
Investor psychology suggests that investors are more comfortable buying a stock after it has moved up and are more willing to sell when it declines sharply. Many investors use the 200 day and the 50 day moving average to make their decisions, however, this simple process can be problematic when the sectors are more volatile. We believe it is wiser to use dollar-cost averaging and set limits on exposure to any asset class and rebalance annually to catch, not chase volatility.
-Frank Holmes
Chairman/CEO/CIO
of U.S. Global Investors Inc.
[FYI
Frank Holmes is doing a webcast today, Tue Jun 20th, at 4:30ET,
you can register
here.]
Please consider carefully the fund's investment objectives, risks, charges and expenses. For this and other important information, obtain a fund prospectus by visiting www.usfunds.com or by calling 1-800-US-FUNDS (1-800-873-8637). Read it carefully before investing. Distributed by U.S. Global Brokerage, Inc.
All opinions expressed and data provided are subject to change without notice. Some of these opinions may not be appropriate to every investor. Gold funds may be susceptible to adverse economic, political or regulatory developments due to concentrating in a single theme. The price of gold is subject to substantial price fluctuations over short periods of time and may be affected by unpredicted international monetary and political policies. We suggest investing no more than 3% to 5% of your portfolio in gold or gold stocks. The AMEX Gold Bugs Index (HUI) is a modified equal-dollar weighted index of companies involved in major gold mining. The S&P 500 Stock Index is a widely recognized capitalization-weighted index of 500 common stock prices in U.S. companies.
321gold Inc
![]()