| |||
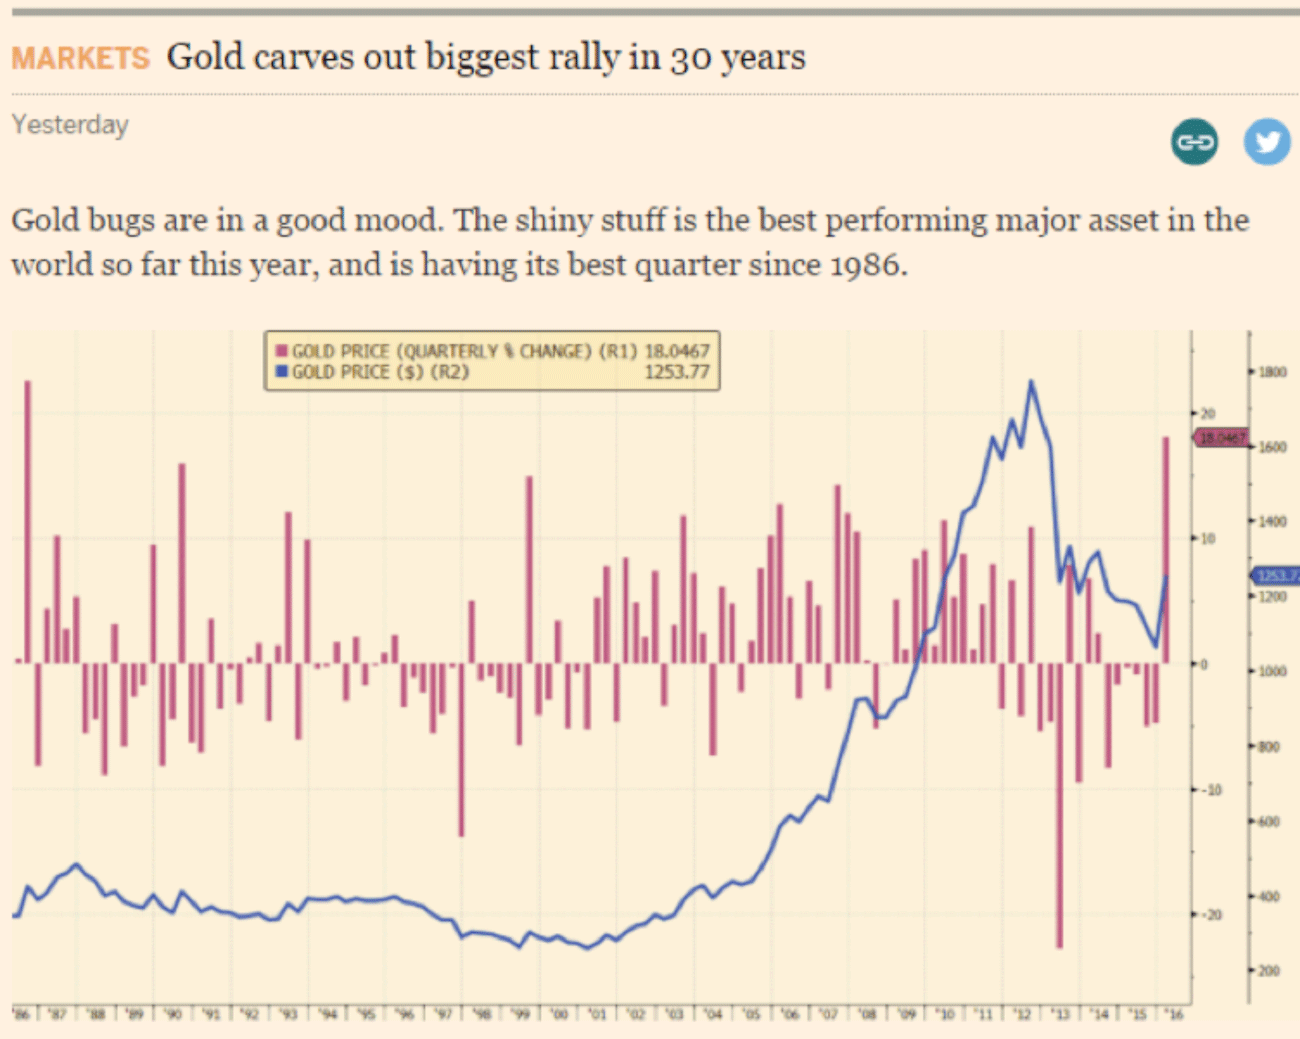
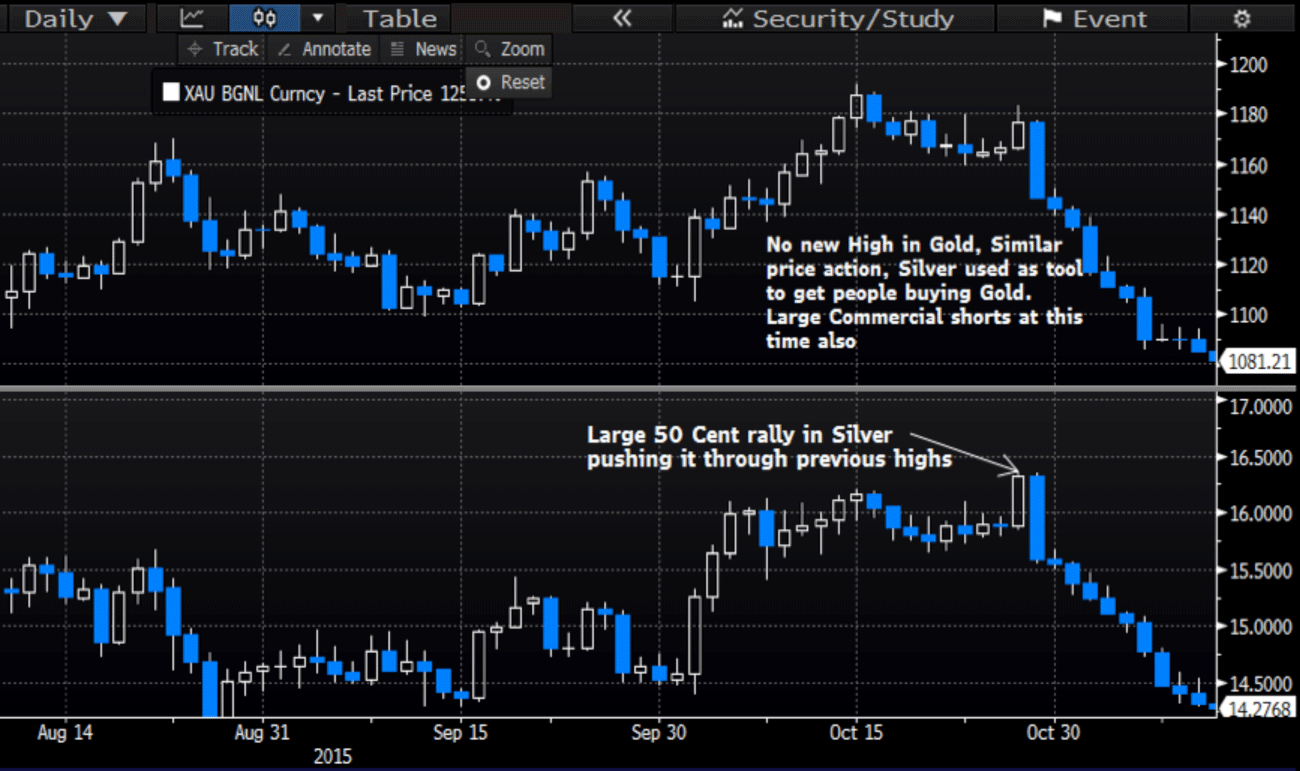
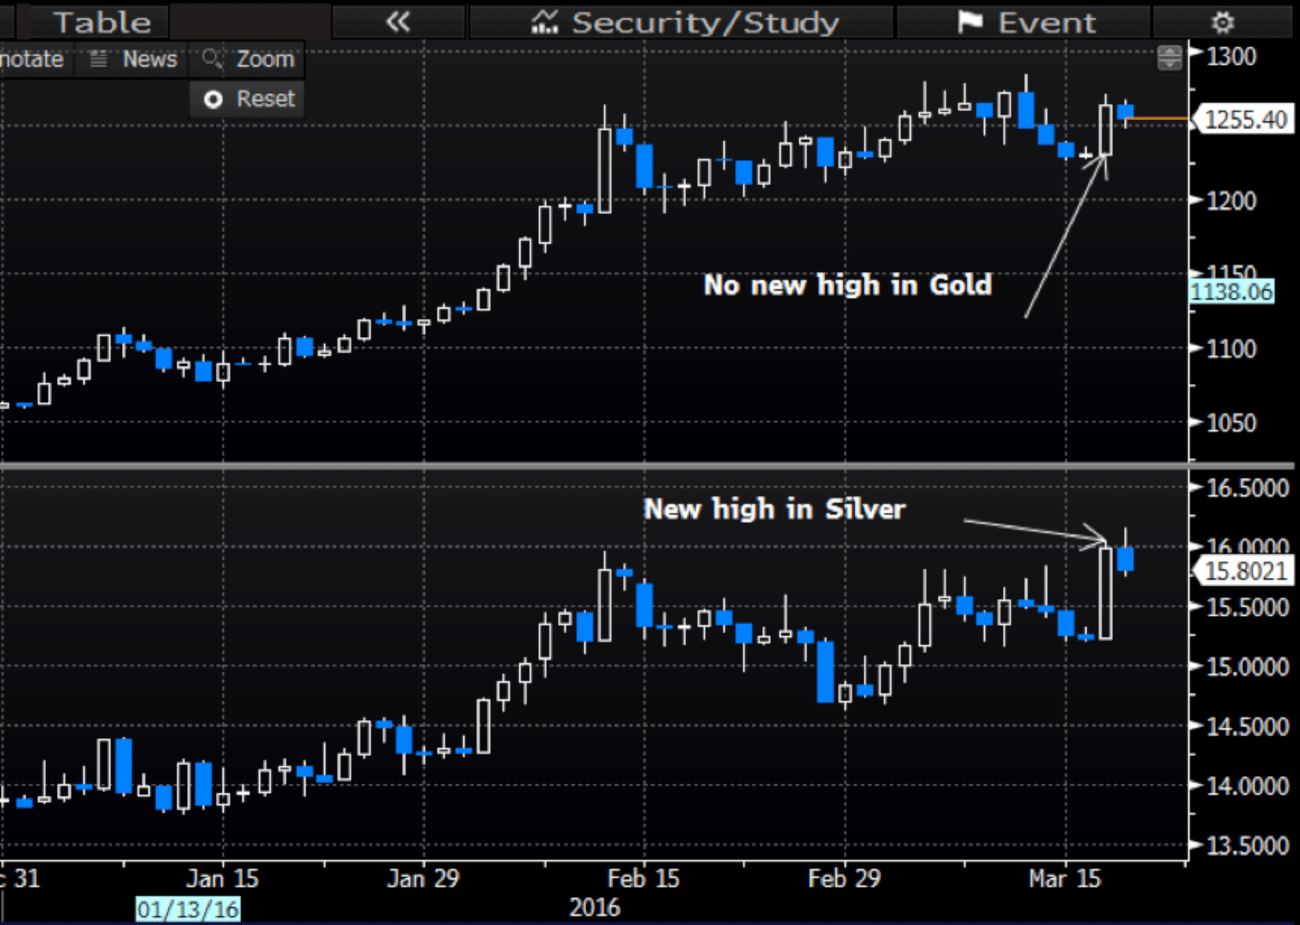
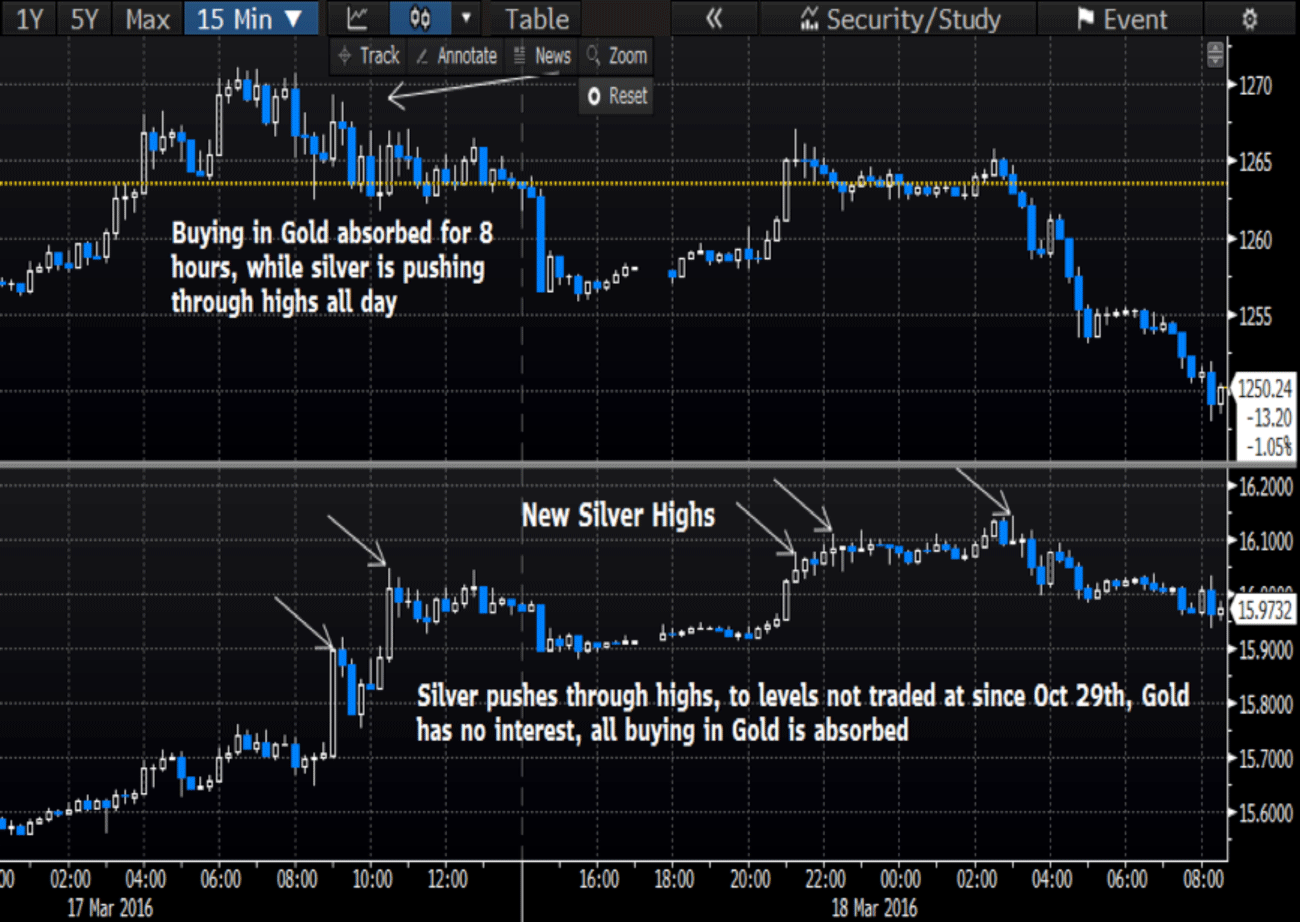
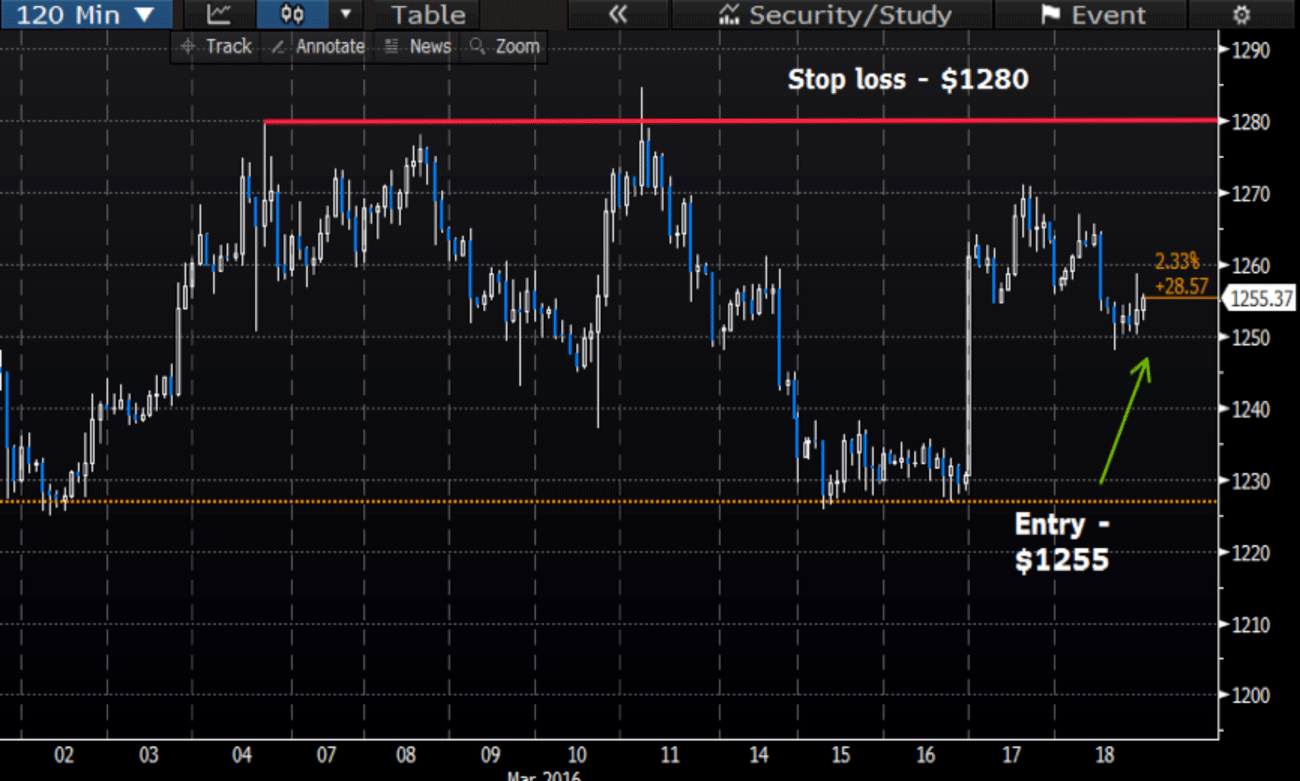
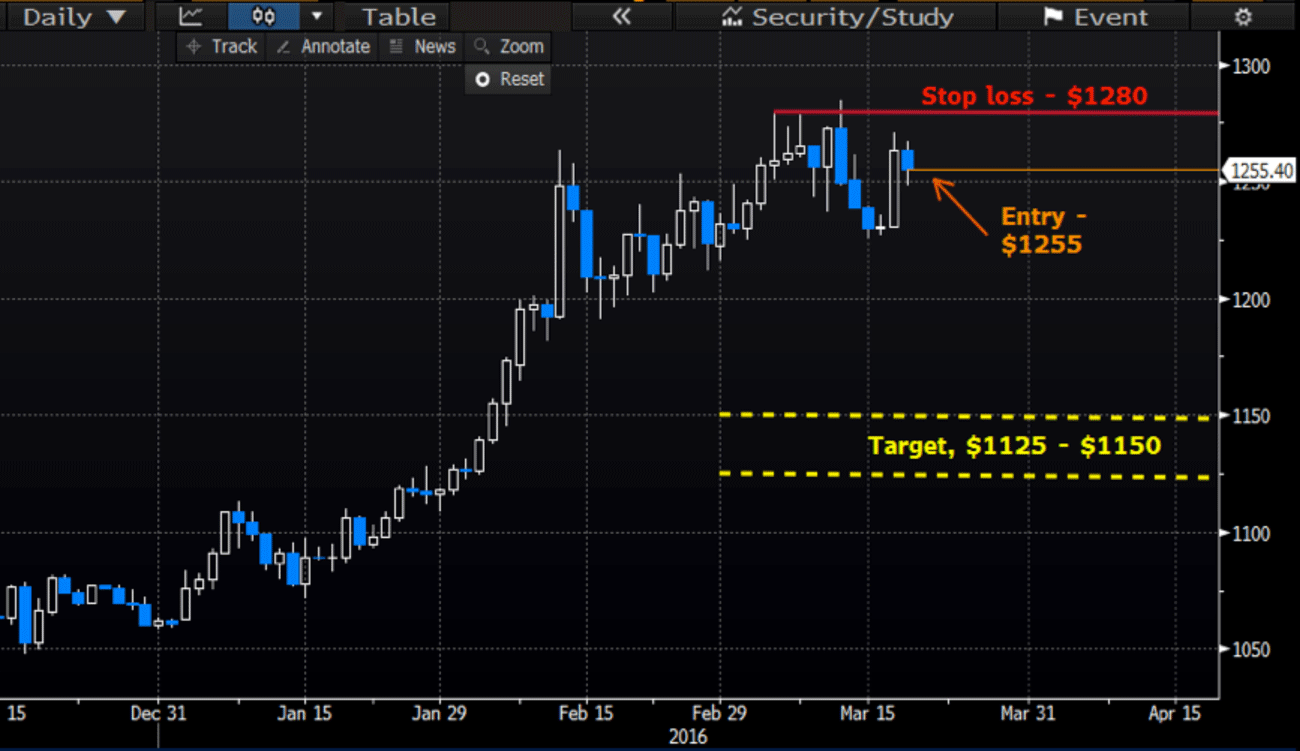
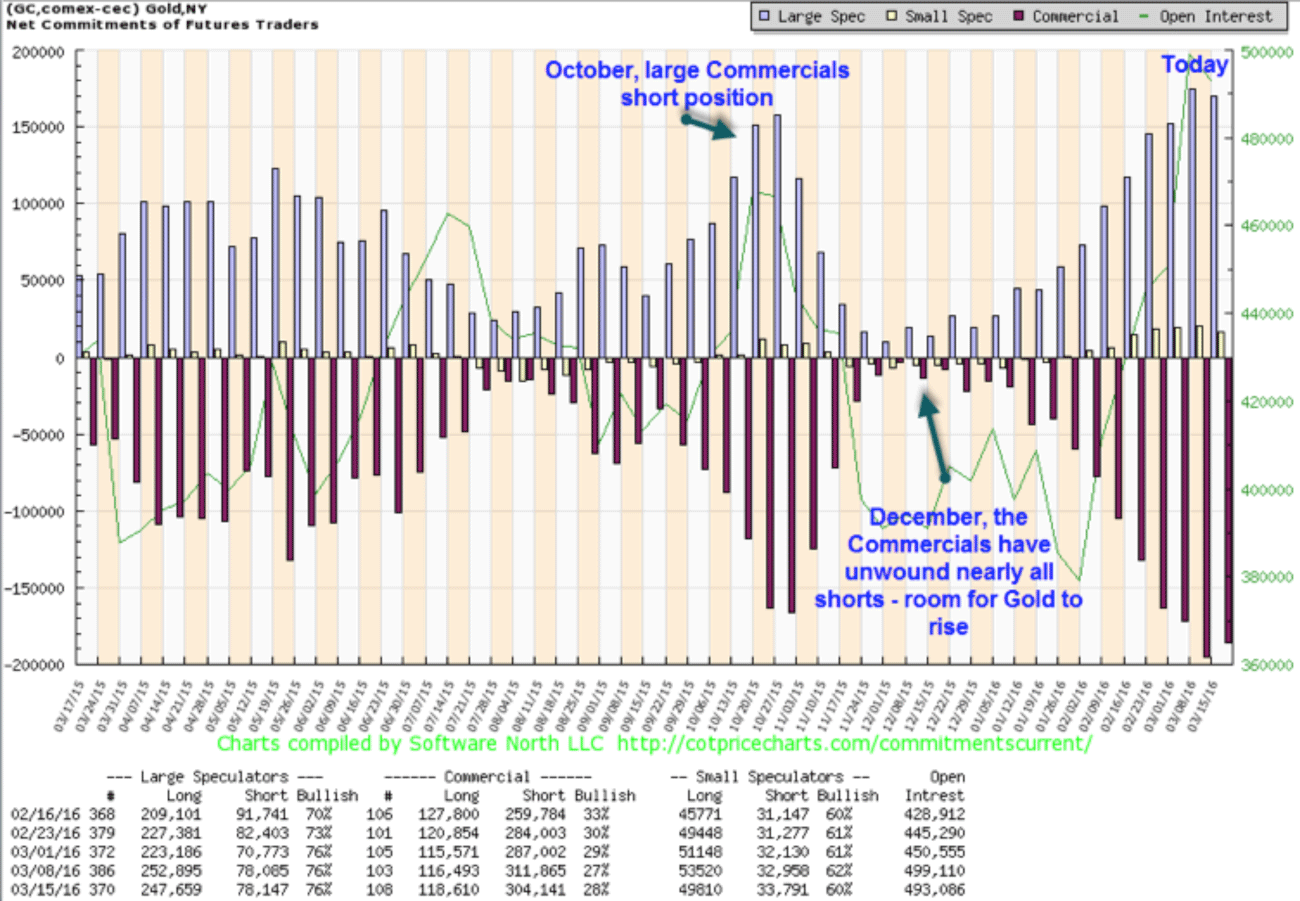
The case for a $100 sell-off in GoldPeter Hegarty Over the last quarter we have seen a large run up in the price of gold from $1061 on January 1st, to a high of $1284 on March 11th. This large and swift increase in price has created a lot of bullish sentiment among investors who once again have declared the bear market over, although what actually appears to have been set up, is another dangerous bear market trap. Gold has had its best quarter in 30 years, however when bear markets end, typically they do not immediately rally the most in 30 years, instead it tends to be a slow drawn out advance which looks like it will sell off at any moment, as we will see this is definitely not the case with gold which has risen 20% in just over 2 months. Along with the bullish sentiment, there are a few other indicators which point to the fact that a $100 sell off in gold is likely over the next few months. Firstly the Commitment of Traders Report published by the CFTC, indicates that the Commercial Banks have built up a very large short position, and large and small speculators have built up extreme long positions, a situation which has preceded declines numerous times in the past. As we can see from the above chart, todays Commercial position is quite extreme, which does not forebode well for gold. This is not a new phenomenon, it is something which plays out over and over, and anyone who looks into the historical data from the CFTC can see that it is never wise to fight the commercials. Let’s take a look at October of last year as an example, and it will lead us on to what is currently developing in the gold and silver markets, where silver is pushing through highs, but gold is not. This is the October sell-off which occurred after the Commercials had built up a large short position. This price action tends to occur around market turning points or at the end of a large move, in the above case it marked the beginning of the sell-off down to $1046, after gold had rallied from $1100 to just over $1187 within a month. Silver is a very thin market and therefore it is easy to move around, especially if you are trading large size. These large rallies in silver tend to create buying interest in gold, and it is strange that this price action occurs at turning points to the benefit of people who are looking to get short or add to short positions. Let’s have a look at gold and silver’s recent price action in light of the large rally we have had, while also considering the current extreme commercial positions. After reviewing the above charts we can see that a lot of this move came after the fed meeting on Wednesday, when the Federal Reserve adopted a ‘more’ dovish tone, however this ‘dovishness’ was only the suggestion that they may delay interest rate rises, which is much more supportive to equities than gold, and the case made for the recent rally in gold was the uncertainty in world equity markets. Since 2011 the Fed has been a lot more dovish at certain meetings and yet the gold bear market has persisted for nearly 5 years, to think that now the fed has decided to slightly delay rate hikes that this immediately creates a bullish case, is a little premature. If anything I think it has been a great opportunity for the bigger players to unload and get short, and the action highlighted below in silver shows that this opportunity has been used. During the trading day on Thursday and Friday I noticed price action which I have seen occur before, around market turning points. That is, that someone or something is using silver as a tool to build or add to a short position in gold. Now, this could be interpreted another way, which is that a market top is indicated because silver is rising and gold isn’t interested and hence an indication of gold losing steam, and topping out. Either way it does not matter, what matters is that this pattern tends to occur around market turning points and once combined with additional information and market analysis, it helps to build a view for a short position in gold and silver, or at least a reduction in any holdings with a view to purchasing back at a lower price. Thursday 03/17, Friday 03/18 From the above charts we can see that silver was being pushed through highs, while gold was not interested in rising further. This action in silver creates buying interest in gold, people see silver rallying strongly and making new highs not seen for 5 months and assume that gold will shortly follow suit. They start to buy gold, yet gold does not rise, all this buying is absorbed. This means that certain people either unloaded or got short(er). The same price action occurred back in October before the sell-off, and it is occurring again at a time when Commercials hold an even larger short position. In addition the recent volatility in World Equity markets appears to have passed, at least until late summer, with the VIX having dropped back into its normal range. This indicates that Volatility may be lower for a while going forward, and this would further add to the downward pressure on gold as people no longer seek the safe haven which they recently rushed to. VIX The question now turns to timing, and when to enter a short position, and I would argue based upon Thursday and Friday’s price action that now would be a good time to enter a position which has a very favourable risk/reward set up. I do not foresee gold making new highs in this move as it has had no interest in doing so over the past few days, therefore a stop loss at $1280 can be placed because if gold should break above that level I would be wrong, at least temporarily. I believe that gold will give back most of its recent gains, and we should at least see the $1150 level, from there we can reassess, but new lows later this year would not surprise me, before this bear market is finally over. This gives a $25 risk with potential $105 gain, or a 4:1 risk/reward. My stop loss is quite tight but this is based on Thursday and Friday’s price action, also there is the potential that the market could range here for a further 2-4 weeks before selling off, in that case I am happy to re-enter later. There is also the potential that I am completely wrong and we rally further. However, from my current analysis which I outlined, I think the most likely scenario is that we test the $1230 area on Monday or Tuesday, this is where we had the quick rally from, after last Wednesday's Fed meeting. From there I think we drift down and test $1200, and if this key area breaks we could see $1150 quite quickly, testing $1150 by mid-April. ### Peter Hegarty Disclaimer: The views expressed in this article are solely my personal opinions and interpretations, they are not recommendations to buy or sell, and readers should in no way take this article as investment advice. 321gold Ltd |