|
|||
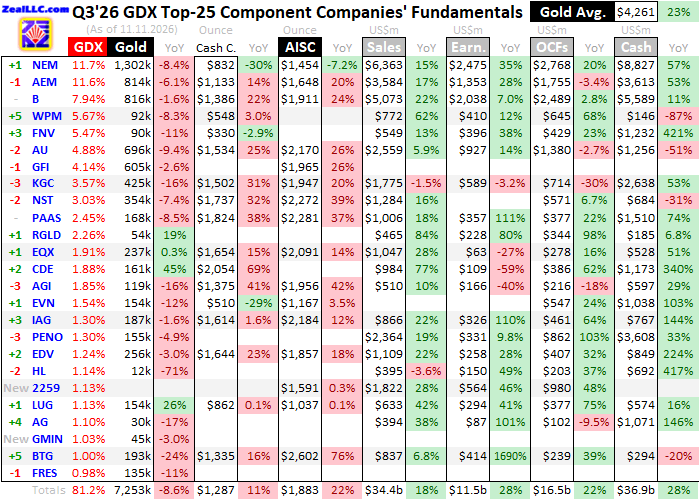
Gold Miners' Q3'26 FundamentalsAdam Hamilton The major gold miners are just wrapping up their Q3 earnings season. Through a wild quarter technically for gold and gold stocks, the miners reported good results. Lower production and general inflation drove up mining costs, reducing profitability. Yet the major gold miners still achieved their fourth-best quarter on record in earnings terms, nearly challenging the third. Fat profits left gold-stock valuations near extreme lows. The GDX VanEck Gold Miners ETF remains this sector's dominant benchmark. Birthed way back in May 2006, GDX has parlayed its first-mover advantage into an insurmountable lead. Its $26.5b of net assets midweek dwarfed the next-largest similar competitor ETF's by nearly 12x! GDX is undisputedly the trading vehicle of choice in this sector, with the world's biggest gold miners commanding much of its weighting. Gold-stock tiers are defined by miners' annual production rates in ounces of gold. Small juniors have little sub-300k outputs, medium mid-tiers run 300k to 1,000k, large majors yield over 1,000k, and huge super-majors operate at vast scales exceeding 2,000k. Translated into quarterly terms, these thresholds shake out under 75k, 75k to 250k, 250k+, and 500k+. Those two largest categories account for fully 48% of GDX. GDX component stocks fared quite well in Q3 proper, as this ETF surged 16.4%! That was on a mere 3.4% gold rally, amplifying their metal's gains by a massive 4.9x! Typically major gold miners leverage gold by 2x to 3x. But gold-stock gains last quarter were far from consistent, including a blistering surge rolling over into a serious selloff. That kind of volatility scares investors, contributing to prevailing sector apathy. From mid-July to late August, GDX rocketed 49.2% higher on a 17.4% gold surge out of major lows for 2.8x! Gold's serious reckoning after its late monster record bull had bottomed, then gold soon exploded higher. That violent mean reversion was fueled by a major technical breakout from a bullish chart pattern and Treasury longer-term bond buying. Gold stocks were flying with their metal, which made for a fun five weeks! But gold's young recovery was short-circuited by soaring Fed-rate-hike odds, pulling forward and greatly exacerbating gold's usual seasonal autumn pullback. So by late October, gold had corrected 16.8% and GDX amplified that a mild 1.6x with a 27.0% loss. That really gutted gold-stock sentiment, fueling the big herd bearishness again plaguing this high-flying sector today. This was the backdrop for Q3 results reporting. For 42 quarters in a row now, I've painstakingly analyzed the latest operational and financial results from GDX's 25 largest component stocks. Mostly super-majors, majors, and larger mid-tiers, they dominate this ETF at 81.2% of its total weighting! While digging through quarterlies is a ton of work, understanding the gold miners' latest fundamentals really cuts through the obscuring sentiment fogs shrouding this sector. This table summarizes the operational and financial highlights from the GDX top 25 during Q3'26. These gold miners' stock symbols aren't all US listings, and are preceded by their rankings changes within GDX over this past year. The shuffling in their ETF weightings reflects shifting market caps, which reveal both outperformers and underperformers since Q3'25. Those symbols are followed by their current GDX weightings. Next comes these gold miners' Q3'26 production in ounces, along with their year-over-year changes from the comparable Q3'25. Output is the lifeblood of this industry, with investors generally prizing production growth above everything else. After are the costs of wresting that gold from the bowels of the earth in per-ounce terms, both cash costs and all-in sustaining costs. The latter help illuminate miners' profitability. That's followed by a bunch of hard accounting data reported to securities regulators, quarterly revenues, earnings, operating cash flows, and resulting cash treasuries. Blank data fields mean companies hadn't disclosed that particular data as of the middle of this week. The annual changes aren't included if they would be misleading, like comparing negative numbers or data shifting from positive to negative or vice-versa. Given Q3's still-lofty prevailing gold prices, I was expecting to see some fantastic results. But surging mining costs cut into major gold miners' ongoing windfall-profits growth. That was disappointing, but understandable given the challenges facing this industry. It underscored the supreme importance of carefully building gold-stock portfolios with handpicked fundamentally-superior miners instead of settling for GDX.
GDX mirrors an underlying gold-stock benchmark called the MarketVector Global Gold Miners Index. It is essentially market-capitalization-weighted, the most-logical way to construct an index. Companies with more investor capital deployed in them should be weighted proportionally, and outperformers should rise up the ranks forcing out underperformers. This dynamic allows constant shuffling in GDX's lower-top-25 ranks. So nearly every quarter a handful of gold stocks being bid higher displaces some being sold lower. That necessary dynamic complicates prior-year-comparable-quarter comparisons. For example over this past year First Majestic Silver surged into GDX's upper ranks, while South Africa's large major Harmony Gold fell out. As a primary silver miner, AG only produced 30k ounces of gold in Q3 compared to HMY's 343k! Had that one shuffling not happened, the GDX top 25's collective Q3'26 production would've fallen 4.7% YoY to 7,566k ounces. But due to this and other displacements, the actual dropped a sizable 8.6% YoY to 7,253k. And that's no anomaly, as during the last six quarters the GDX top 25's output has run -9.6%, -6.5%, -15.7%, -10.7%, -10.4%, and that -8.6% YoY! Failing to overcome depletion is a big problem for majors. Considered across the last 42 quarters I've been advancing this research thread, the GDX top 25's output is now less than 1/5th up into that entire span's range! That peaked nearly a decade ago in Q4'16 way up at 9,525k ounces. And declining gold-mining production isn't systemic, as proven by the excellent quarterly Gold Demand Trends reports from the World Gold Council. These are must-reads for gold-stock investors! GDTs include gold's best-available global fundamental supply-and-demand data. Per the latest Q3'26 GDT, over these same last six quarters world gold-mining production actually clocked in at +2.1%, +4.2%, +1.6%, +3.6%, -1.1%, and +2.9% YoY! So the major gold miners dominating GDX's upper ranks have long been dropping the ball. Most of the world's output growth comes from smaller mid-tier and junior miners. Mid-tiers have always been superior to the majors. Running smaller stables of typically one-to-four gold mines, any sizable expansions or new mine-builds really move the needle to grow mid-tiers' production. They not only easily overcome depletion unlike their larger peers, but consistently achieve sizable output growth as a group. Smaller gold stocks enjoy outsized gains around new expansions and mines coming online. Production growth is essential in gold mining because it provides the cashflows necessary to continue expanding existing mines and building or buying new ones, ultimately driving stock prices higher. And surprisingly mid-tiers often have lower mining costs than majors, despite the latter's supposed economies of scale. That makes mid-tiers much more profitable relative to their production, supporting bigger stock gains. That's why we've always specialized in trading smaller mid-tier and junior gold miners at Zeal. Over a quarter-century now to Q3'26, we've realized 1,663 stock trades in our weekly and monthly subscription newsletters. The vast majority gold and silver stocks, their average annualized realized gains over that long span are running +19.9%! That includes all losers, and is the kind of track record hedge funds would kill for. Next week I'm going to write about the GDXJ-top-25 gold miners' Q3 results, GDX's little-brother mid-tier-dominated gold-stock ETF. They should trounce the GDX top 25's like usual. GDX includes some great gold miners, but I'd never want to own it because deadweight supermajors and majors command much of its weighting. Their shrinking production also considerably impairs their profitability by driving up mining costs. Unit gold-mining costs are generally inversely proportional to gold-production levels. That's because gold mines' total operating costs are largely fixed during pre-construction planning stages, when designed throughputs are determined for plants processing gold-bearing ores. Their nameplate capacities don't change quarter-to-quarter, requiring similar levels of infrastructure, equipment, and employees to keep running. So excluding rarer mine expansions, existing mines have fixed tonnages of ores they can process each quarter. That makes ore grades fed into their plants the primary variable driving gold production, and those vary widely even within individual gold deposits. Richer ores yield more ounces to spread mining's big fixed expenses across, lowering unit costs and boosting profitability. Over time mines' ore grades decline. Mining plans naturally target richer ores first, which are eventually depleted leaving poorer ones. The majors and super-majors try to overcome this by acquiring new mines from other companies, which is very expensive. Since it usually takes over a decade to permit and build new mines, organic growth is also too slow. The big-to-vast scales majors and super-majors operate at simply haven't proven sustainable. Cash costs are the classic measure of gold-mining costs, including all cash expenses necessary to mine each ounce of gold. But they are misleading as a true cost measure, excluding the big capital needed to explore for gold deposits and build mines. So cash costs are best viewed as survivability acid-test levels for the major gold miners. They illuminate the minimum gold prices necessary to keep the mines running. In Q3'26 the GDX top 25's average cash costs surged 11.1% YoY to $1,287 per ounce, their third highest on record. Of course that's still far below prevailing gold prices, nothing to worry about at all. Skewing cash costs high was Coeur Mining's extreme $2,054 per ounce. CDE not only irritatingly refuses to report all-in sustaining costs like nearly every other gold miner, but uses a unique bastardized cash-cost substitute. Last quarter CDE's "adjusted costs applicable to sales" skyrocketed 69.1% YoY partially because of "$40 million of non-cash expense related to purchase price allocation ascribed to inventory, which added $245 per ounce". That is odd accounting treatment of Coeur's buyout of great mid-tier miner New Gold back in late March. Ironically New Gold was a low-cost miner, with true cash costs in the comparable Q3'25 of just $639! CDE's were $1,215 then, so you'd think acquiring NGD's excellent mines would drive down Coeur's overall cash costs. I've long railed against larger gold-stock mergers because bigger worse miners acquiring smaller better ones seldom yields expected synergies. Instead the value of mid-tiers' and juniors' superior mines is seriously diluted in majors' stables. Without CDE, Q3'26's GDX-top-25 cash costs averaged $1,239. All-in sustaining costs are far superior than cash costs, and were introduced by the World Gold Council in June 2013. They add on to cash costs everything else that is necessary to maintain and replenish gold-mining operations at current output tempos. AISCs give a much-better understanding of what it really costs to maintain gold mines as ongoing concerns, and reveal major gold miners' true operating profitability. Last quarter's collective AISCs among the GDX top 25 averaged a record $1,883 per ounce, surging a vexing 22.0% YoY! That was much worse than I expected, and extended the latest-three-quarter trend to +24.9%, +25.6%, and +22.0% YoY! After wading through all these GDX-top-25 quarterlies and plenty more from the gold-stock trades we own, the two primary drivers of soaring AISCs were royalties and inflation. Cash costs account for the lion's share of AISCs, making for over 2/3rds of the GDX top 25's in Q3. One of their components is royalty expenses, which move proportionally with prevailing gold prices. In Q3'26 quarterly-average gold prices surged 23.2% YoY to $4,261 per ounce, the third highest ever witnessed! That drove up royalty expenses for a sizable fraction of the world's gold mines that contractually pay them. Royalties are typically based on percentages of gold prices. Large mid-tier miner IAMGOLD does the clearest reporting on royalties' impacts, as it supplements both its cash costs and AISCs with what they would've been ex-royalties. In Q3'26 those cash costs ran $1,614 and $1,266, while AISCs were $2,184 and $1,836. So for that particular miner, royalty expenses forced up cash costs and AISCs 27.5% and 19.0%! The comparable Q3'25 numbers at lower gold prices were $1,588 and $1,338 for cash costs and $1,956 and $1,706 for AISCs, or royalties boosting them by 18.7% and 14.7%. Another miner Pan American Silver breaks out overall royalties in its income statement. They soared 53.8% YoY in Q3'26, much faster than its cash costs and AISCs up 37.7% and 36.6%! Higher gold means higher royalties means higher costs. Surging general inflation also pushed up global gold-mining costs, primarily driven by Trump's war with Iran in recent quarters. In the US in Q3, national-average retail diesel prices skyrocketed 48.1% YoY to $5.56 per gallon! And diesel prices were even worse in more remote parts of the world where many gold mines are located. The US runs a huge diesel surplus, and is the world's largest exporter of that essential fuel. All the heavy equipment necessary to mine gold including giant excavators and massive haul trucks runs on diesel. Plenty of the GDX top 25 mentioned energy prices as a key driver for their higher mining costs last quarter. Agnico Eagle Mines attributed its own "primarily due to higher labour costs, higher energy costs related to diesel prices, higher royalty costs resulting from higher gold prices and lower production". AEM also warned that its full-year-2026 AISCs would come in "near the upper end of the guidance range" at $1,550 "reflecting the adjusted production plan and input cost pressures, primarily related to diesel." And Kinross Gold similarly said its own surging costs were "primarily due to higher energy, contractor and reagent costs, lower production and an increase in royalty costs as a result of the higher gold prices." A few weeks ago Tom Bodrovics interviewed me for his excellent Competent Investor Podcast, and had a shocking question I hadn't considered. What if some gold mines couldn't source sufficient diesel to keep operating? That won't happen in the US, but way out in boondocks Guyana or the Ivory Coast who knows. Just like for the entire world economy, soaring diesel prices due to Trump's war are a problem for gold miners. While we're on AISCs here, I have to mention the world's largest gold miner Newmont was the only GDX-top-25 company to report lower ones in Q3'26. Sadly that's an accounting fiction. Financial reporting is a game, companies trying to present their operations in the best-possible light to maximize their stock-price appreciation and thus executive compensation. So they are constantly reframing results to look more favorable. Over this past year, Newmont switched its lead unit mining costs reported on quarterlies from being co-product to byproduct ones. The latter are way more common since they credit sales of any other metals mined to gold, lowering its reported unit costs. If NEM's byproduct ones in Q3'25 are used instead, its AISCs actually climbed 11.6% YoY in Q3'26! No GDX-top-25 gold miners were immune to rising costs. Yet highlighting why I've always preferred smaller mid-tiers and juniors, Lundin Gold fared the best out of all the GDX top 25 last quarter. Its AISCs merely edged up 0.1% YoY in Q3'26, to a best-in-the-GDX-top-25 $1,037 per ounce which is wildly profitable! LUG's production also surged 25.9% YoY, compared to NEM's falling 8.4%. LUG's market cap is also 1/8th of NEM's, making it far easier to bid its stock price higher. Ideally gold miners' AISCs would only rise gradually, not surge like these last few quarters. But instead of worrying about absolute levels, it is illuminating to consider AISCs as a ratio to prevailing gold prices. Yes Q3'26's GDX-top-25 average was a record high absolutely, but at just 44.2% of quarterly-average gold that was also the fifth lowest ever in relative terms! The gold miners are doing fine despite royalties and inflation. After my quarter-century-plus of intensely studying this sector, I've found the best metric for measuring gold miners' collective fundamental performance is their implied unit earnings. That simply subtracts the GDX-top-25 average AISCs from the quarterly-average gold price. This is way cleaner than bottom-line accounting profits, since a varying GDX-top-25 subset's are usually distorted by big noncash charges or gains. Again Q3'26's quarterly-average gold price soared 23.2% YoY to $4,261, its third highest ever. That slightly outpaced the GDX top 25's average AISCs' 22.0% surge, combining for great implied sector unit profits of $2,378. Those still surged a respectable 24.2% YoY to their fourth-highest levels on record after the preceding three quarters'! Major gold miners are still earning money hand-over-fist in this environment. And that's nothing new, just the latest quarter in a long trend of phenomenal earnings growth unparalleled across all the stock markets. Over the last 13 consecutive quarters ending Q3'26, these GDX-top-25 implied unit earnings have soared 87%, 47%, 31%, 75%, 74%, 78%, 90%, 78%, 83%, 106%, 113%, 46%, and that 24% YoY! But after that extraordinary run, this streak will likely give up its ghost in this current Q4. The general-inflation and soaring-energy pressures on gold miners aren't abating. And almost halfway through Q4, gold is averaging $4,084 quarter-to-date compared to the comparable Q4'25's $4,150. If quarterly-average gold prices slump in Q4, it will be their first negative quarter since Q4'22! Major gold miners will continue to earn hefty profits, but lower gold and higher costs won't make for annual earnings growth. Gold miners' hard accounting results reported to securities regulators under GAAP or other countries' equivalents confirmed their ongoing strong fundamentals last quarter. Realize all these numbers are a little understated, as new GDX-top-25 component G Mining Ventures didn't report its Q3 results until after this essay's data cutoff. Financially the major gold miners' latest results continue to look pretty fantastic. The GDX top 25's collective revenues surged 17.6% YoY to $34.4b in Q3'26, their fourth highest ever. That fed rich bottom-line accounting profits of $11.5b, soaring 27.9% YoY to also their fourth best on record. Operating cash flows surged 21.9% YoY to $16.5b, swelling cash treasuries 28.5% higher YoY to $36.9b. Those were fourth and third highest, vast buying firepower to expand existing mines and build new ones. Back to earnings, all those strong quarters combined with recently-battered gold-stock technicals have left the GDX top 25's average trailing-twelve-month price-to-earnings ratios running just 16.8x! That is the second lowest in the last 42 quarters of this research thread, and likely ever! Only the preceding Q2'26 was a bit better at 16.5x. The gold stocks remain screaming buys fundamentally today, incredible bargains! So though the major gold miners have long failed to consistently grow their production and chronically underperform their smaller mid-tier and junior brethren, they just reported another good quarter! Sooner or later some critical mass of professional investors running funds will increasingly recognize the extreme value in this small contrarian sector. Them flooding in to chase gains will catapult gold stocks way higher. Successful trading demands always staying informed on markets, to understand opportunities as they arise. We can help! For decades we've published popular weekly and monthly newsletters focused on contrarian speculation and investment. They draw on my vast experience, knowledge, wisdom, and ongoing research to explain what's going on in the markets, why, and how to trade them with specific stocks. Our holistic integrated contrarian approach has proven very successful, and you can reap the benefits for only $12 an issue. We extensively research gold and silver miners to find cheap fundamentally-superior mid-tiers and juniors with outsized upside potential. Sign up for free e-mail notifications when we publish new content. Even better, subscribe today to our acclaimed newsletters and start growing smarter and richer! The bottom line is major gold miners dominating GDX just reported their fourth-best quarter ever. That's no mean feat against the backdrop of surging inflation fueled by Trump's war. That along with gold-driven higher royalties forced mining costs to records, combining with shrinking production to slow recent years' epic profits growth. Still that streak of big double-digit year-over-year gains extended to a remarkable 13 quarters. Gold's recent selloff on Fed-rate-hike fears will likely slay that in this current Q4, barring some enormous mean-reversion-overshoot rebound. Yet major gold miners will still continue earning fat profits absolutely, with valuations near record lows. That makes this usually-overlooked high-flying sector a screaming buy today. Gold-stock prices remain far too low to reflect their massive profitability with these prevailing gold levels. ### Nov 13, 2026 Thoughts, comments, or flames? Fire away at zelotes@zealllc.com. Due to my staggering and perpetually increasing e-mail load, I regret that I am not able to respond to comments personally. I will read all messages though and really appreciate your feedback! 321gold Ltd |