|
|||
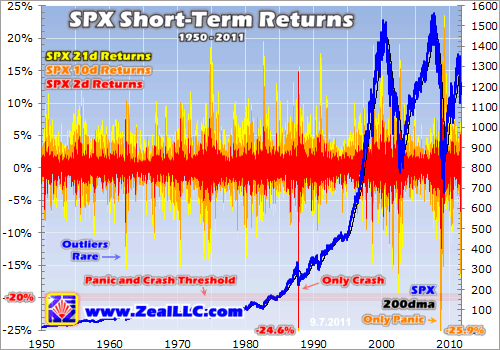
Stock-Bear SellingAdam Hamilton Early August’s sharp stock-market plunge ignited an explosion of bearish theories. And with the headline stock indexes still grinding along near lows over the month since, fears of a new bear market continue to proliferate today. But interestingly, the fast selling velocity that spooked traders is not characteristic of young bear markets. Instead it is a bull-market-correction phenomenon. Everyone knows that stock markets behave very differently in bulls and bears, trending higher in the former and lower in the latter. But these differences extend far beyond the superficial obvious. It’s not only the direction of movement that’s different, but the way these moves unfold. The price-action velocities seen over days and weeks often vary considerably between bulls and bears. This knowledge is very valuable for prudent speculators and investors. It offers excellent secondary clues on where the markets likely are in their bull-bear cycles, which is crucial for making sound trading decisions. The ideal time to buy low is early in a bull market just after a bear, then the ideal time to sell high is late in a bull just before a bear. So gaming the bull-bear cycles is essential for success. Since new-bear-market theories are so in vogue today, I’m going to focus on selling velocities in stock bears in this essay. The word velocity describes a rate of change over a period of time. The larger the change, and/or shorter the time, the higher the velocity. Before we delve into stock-bear selling velocities though, it is important to have a long-term baseline as a point of reference. This first chart looks at the short-term returns in the flagship S&P 500 stock index (SPX) for its entire history. While using a non-logarithmic chart really distorts long-term percentage changes, it is not the SPX itself we are interested in. The important data is the short-term returns for the US stock markets as represented by the SPX. Positive returns are buying velocities, while negative ones are selling velocities. The red, orange, and yellow series respectively represent the 2-trading-day, 10-trading-day, and 21-trading day returns in the SPX. Though 2, 10, and 21 may seem illogical and arbitrary, they are actually anything but. In this massive 6-decade reference chart, pay close attention to where short-term stock-market returns usually run as well as their outliers. Both are key for understanding stock-bear selling.
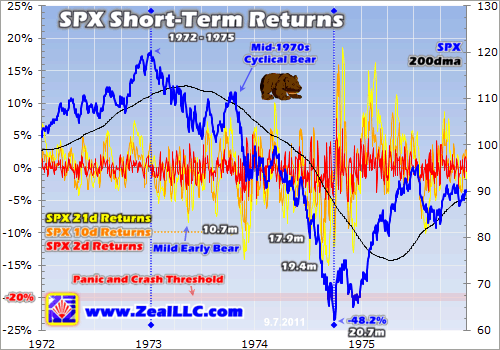
Since 1950 there have been about 15,500 trading days. And the vast majority of the time their short-term returns were clustered between +5% and -5%. In terms of 2-day returns, only 0.66% of these trading days saw velocities exceeding these 5% bands. Of course as the time over which a velocity is measured increases, so does the underlying change. In terms of 10-day returns, only 0.76% of the trading days in this lifetime-long span exceeded +10% or -10%. Thus these outliers are very rare. 2-day returns are critical for selling analyses because that is the period of time that defines a crash. While most traders today casually toss around this scary word during any sharp selloff, technically a crash is only a 20%+ plummet in the stock markets in 2 trading days or less. Over the past 2/3rds of a century, there has only been a single crash. On October 19th, 1987, cascading program selling at the dawn of computerized trading drove a breathtaking 20.5% SPX plummet in a single trading day! 10-day returns are also essential for selling analyses because they represent the time over which slower panics unfold. A panic is a 20%+ plunge in the stock markets in 10 trading days or less, a couple weeks. The only panic in modern history occurred during autumn 2008, when a variety of frightening selling catalysts coalesced to drive a monster 25.9% 10-trading-day plunge in the flagship US stock index. Thankfully these brutal fear maelstroms are also extremely rare. So 2-day and 10-day periods define the most-dreaded selling events the stock markets ever witness. And the final 21-day metric simply represents a rolling month. Thanks to our monthly calendar, a single-month timeframe is intuitively and naturally understood by all traders. And an average calendar month has 21 trading days. So looking at short-term SPX returns over this trio of spans captures both the most-extreme and easily-understood selling timeframes. With these baseline returns in mind, we can move on to stock-bear selling. The SPX’s short-term returns in cyclical stock bears create a kind of unique signature traders can use to help identify them in real-time. Going all the way back 4 decades, there have only been 3 major cyclical bears. The first was in the middle of the last secular bear in the 1970s, and then 2 more plagued the 2000s. The 1980s and 1990s didn’t see any because the stock markets were enjoying the secular-bull stage of their Long Valuation Waves. Even a third of a century later, the dark memories of that mid-1970s cyclical bear scarred so many traders that it is still discussed fairly often today. Between January 1973 and October 1974, the US stock markets as represented by the benchmark S&P 500 lost 48.2% of their value. While this bear didn’t reach terminal panic velocity like the one in 2008, its tail end in 1974 has long been remembered as a near-panic.
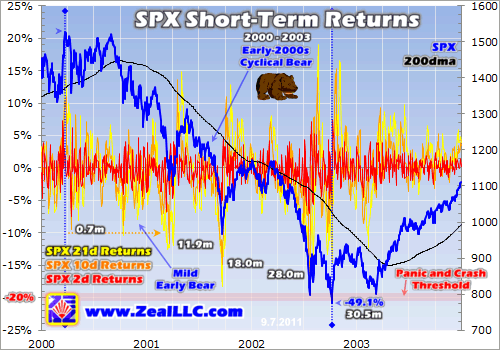
But though the latter days of this infamous bear were unbelievably brutal, its initial selling was very mild. No one seems to remember this critical bear fact anymore! We can prove this empirically with stock-bear selling velocities. Remember that over the SPX’s entire history, 99.3% of 2-day spans didn’t exceed 5% moves in either direction while 99.2% of 10-day spans didn’t exceed 10%. You statistics buffs know these metrics nearly perfectly match the 99.7% 3-standard-deviation threshold of a normal distribution. When anything is 3 standard deviations away from its average, it is absolutely a rare event worth paying attention to. The first 3-standard-deviation selloff in both 2-day and 10-day terms in that terrible mid-1970s cyclical bear didn’t occur until November 1973, fully 10.7 months into it! And it wasn’t until 17.9 months in that these rare outlying selloffs started clustering. This was near that bear’s end, not its birth! High-velocity selloffs like we saw in early August 2011 are not seen early in bear markets. The reason is simple, stock-bear psychology. Sharp selloffs spark extreme fear, which scares speculators and investors alike into dumping stocks to rush their capital out of harm’s way. But the mission of a bear market is to do the most damage possible. It accomplishes this by lulling traders into a sense of complacency for as long as possible. The longer that a bear can grind lower gradually in stealth mode without sparking fear prematurely, the more traders it will trap and maul. Bear markets seek to destroy the most capital from the greatest number of traders before they mature. It isn’t until late in cyclical bears, after the majority of traders have already ridden the gradual low-velocity trend lower, that bears get aggressive. Big, sharp, high-velocity fear-spawning selloffs are not early-bear events! They are actually nearly impossible to ignite then, because overwhelming complacency persists from the previous cyclical-bull highs that led into the cyclical bear. This low-selling-velocity early-bear pattern continued in the next cyclical bear, which didn’t arrive until decades later thanks to the intervening secular bull. Between March 2000 and October 2002, the SPX lost 49.1%. Yes, cyclical bears generally cut the stock markets in half, which is why they are so dreaded! Once again, 3-standard-deviation selloffs generally didn’t start happening until this bear was maturing.
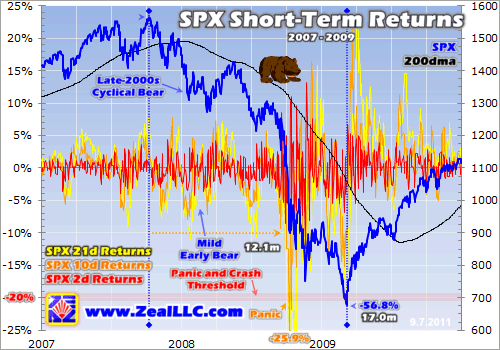
With a notable exception, the early part of this bear was again mild. Big high-velocity selloffs weren’t decisively seen until 11.9 months after its birth. Just like in the mid-1970s cyclical bear before it, this bear didn’t start baring its claws and igniting fear until nearly a year in. The longer a bear can delay before high-velocity selloffs begin, the more speculators and investors fail to recognize it. Thus much more capital remains in harm’s way, exposed to the bear’s predations. The exception was a sharp SPX selloff only 0.7 months into this bear. That coincided with the end of the 17-year secular bull in early 2000. While the SPX certainly didn’t get anywhere near approaching that 20% in 10 trading days or 2 trading days panic-or-crash threshold, it still fell sharply in sympathy with the plunging NASDAQ. Collapsing 27.4% in just 10 trading days, there was certainly an extreme selling event in hyper-overbought tech stocks after their popular mania. At the time it sure felt like a crash! Indeed at the ends of secular bulls are when crashes are the most likely. Though ultra-rare (there were only 2 in the past century), crashes erupt out of multi-decade highs riddled with extreme greed and complacency. They never occur right after significant selloffs, so the risk of a crash this autumn that some alarmist analysts are flogging is nonsensical. Today’s stock markets are only 30 months into a cyclical bull within a secular bear, about as far as you can get from the terminal-secular-bull conditions necessary to spawn a crash. The next cyclical bear mauled away 56.8% of the capital deployed in stocks between October 2007 and March 2009. This bear climaxed in a once-in-a-century stock panic, the first true one since 1907! That accelerated this bear, forcing more selling into less time which shortened its lifespan but amplified its severity. But despite this epic extreme selling event, the early-bear action in our latest cyclical bear was once again gradual. The early selloffs were all low-velocity, nowhere close to hitting the 3-standard-deviation thresholds of 5% in 2 days and 10% in 10 days.
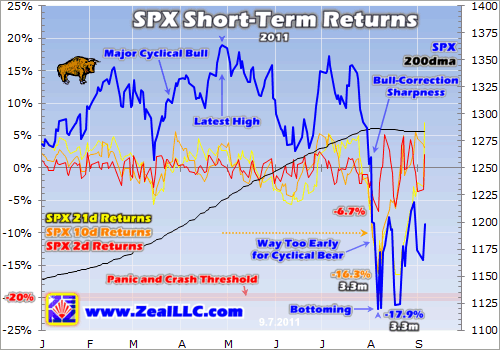
The mild early bear between late 2007 and late 2008 didn’t see any high-velocity selloffs to generate major fear spikes. Once again this gradual somewhat-stealthy approach kept speculators and investors lulled into complacency for as long as possible before the sharp selling erupted. Bears do not like to make their presence known prematurely, as an early warning would motivate many traders to cash out before the brunt of the bear’s work was done. The first 3-standard-deviation selloffs didn’t occur until 12.1 months into this bear, actually when 2008’s stock panic started to cascade lower. This panic’s position in the bull-bear cycles is also critical to consider. These ultra-rare extreme selling events only occur at one very specific time, late in cyclical bears as they mature. The alarmist analysts calling for another panic this autumn once again haven’t studied market history. If we are in a new bear as they argue, it is a mere babe at several months old! Expecting another panic now is also foolish for psychological reasons. Panics and crashes are ultra-rare because it takes decades to build up enough complacency, and popular levels of capital invested, to fuel such extreme selloffs. The general public has to be utterly convinced that stocks are going to surge higher forever, that stocks are the only great destination for capital. Popular greed has to wax extreme, mania-like. Like a once-in-several-decades wildfire, panics and crashes quickly rage through this long-accumulated fuel and leave a devastated psychological wasteland in their wakes. Sentiment and investment levels don’t fully recover for a decade or more after. So a new panic this autumn just 3 years after the last one is as improbable as a new epic wildfire just a few years after the last one thoroughly burned out an area. It is impossible because insufficient new fuel has grown back in! Back to the task at hand, in the last 3 cyclical bears the first true 3-standard-deviation selling events didn’t happen until 10.7 months, 11.9 months, and 12.1 months in. This averages out to 11.6 months, or nearly a year before an emerging bear finally starts making some noise and showing its true colors. Early bears spend nearly a year masking their true nature, hiding stealthily behind low-velocity-yet-persistent selling to keep traders slumbering unaware for as long as possible. Which finally brings us to today, an ugly environment where perma-bears, chicken littles, and pessimists are coming out of the woodwork to declare a new bear market is upon us. Why? Simply because of that high-velocity 3-standard-deviation-plus stock-market plunge in early August. Here’s the last chart, which zooms in this SPX-short-term-return analysis to encompass 2011 alone.
Now no one argues that the massive 101.6% surge over the 25.7 months between March 2009 and April 2011 was anything but a cyclical bull within a secular bear. So if a new bear is indeed starting to flex its muscles, its indisputable start date has to be the end of April 2011 when the SPX hit its latest interim high. Thus by early August’s sharp selloff, any new bear could only have been 3.3 months old! A cuddly bear cub at best. And that early-August selloff was so extreme that it was far beyond the 3-standard-deviation threshold. At worst, the SPX plunged 6.7% in 2 trading days and 16.3% in 10 trading days. So while it wasn’t anywhere near crash-magnitude, it did make a surprisingly-spirited attempt at panic-magnitude. This particular sharp selloff on a chance convergence of intense anxiety and a hard selling catalyst (the USA debt downgrade) was exceptionally intense even by mature-bear standards. So not only do we have an extreme selloff way too early in a new alleged bear, it is way higher-velocity than even most late-bear selloffs. Events like this are not characteristic of young bears at all, they short-circuit the entire mission of bears to cunningly trap traders. If a young bear scares too many traders into exiting too soon, it not only can’t do its work but it exhausts its selling fuel prematurely and burns itself out. In contrast, sharp and scary selloffs like the early-August one are seen most often in cyclical-bull corrections. As a bull market marches ever higher, speculators and investors grow very greedy and complacent. Soon everyone interested in buying stocks anytime soon has already bought, and traders expect the stock markets to continue powering higher indefinitely. The spring of 2011 was plagued by such overbought sentiment conditions. The only way to rebalance away this excessive greed is through a sharp selloff that ignites a major fear spike. I discussed such fear spikes a couple weeks ago in an essay on the stock fear ceiling. Thus healthy corrections within ongoing bull markets tend to spawn some of the highest-velocity selloffs ever seen in the stock markets. Make no mistake, the recent plunge in early August exhibits all the defining hallmarks of a bull-market correction. This means we are almost certainly not in a new cyclical bear today! While this stock-bear-selling analysis is pretty compelling, I only consider it secondary. Back in late June I wrote an essay based on bull-bear cycles showing why a new cyclical bear is very unlikely to be born in 2011. If all the doomsday naysaying has you worried about the prospect for a new bear today, go read that all-important stock-cycle analysis. But it’s still always nice to have corroborating evidence like this look at stock-bear selling velocities provides. At Zeal we are hardcore speculators and students of the markets. Rather than mindlessly believing whatever theories are popular based on current market action, we strive to understand the markets in broader context. This helps us ignore our own greed and fear while capitalizing on others’ to buy low and sell high. This contrarian approach has been wildly successful. Since 2001, all 591 stock trades recommended in our subscription newsletters have averaged annualized realized gains of +51%! The only way to thrive in the markets is to be contrarian, buying low when others get scared (like today) and then selling high when others grow greedy. Thus we’ve been taking advantage of all this irrational fear by buying oversold high-potential commodities stocks. With the SPX still low, it isn’t too late to deploy capital in elite stocks for the next upleg of this cyclical bull. Subscribe today to our acclaimed weekly or monthly newsletters! Start better understanding what the markets are doing, why, and how to trade them. The bottom line is stock bears exhibit telltale selling patterns. For most of their first year, they tend to sell off gradually. This low-velocity selling keeps traders complacent and capital deployed so the bear can wreak the most-possible damage. It isn’t until later in bear markets, after the majority of selling has already happened, that bears emerge from stealth mode to show their true colors. This is when the scary high-velocity selling events start to happen, rapidly spiking fear. The recent anomalous early-August plunge was far too extreme to be seen so soon in the alleged bear that had to have started in late April if it actually exists. Sharp selloffs like this are characteristic of healthy bull-market corrections, not waking-up bear cubs. There is simply no basis in modern stock-market history to claim that early August’s sharp selloff was some kind of new-bear-market indicator. ### Sep 9, 2011 Thoughts, comments, or flames? Fire away at zelotes@zealllc.com. Due to my staggering and perpetually increasing e-mail load, I regret that I am not able to respond to comments personally. I will read all messages though and really appreciate your feedback! 321gold Ltd |