Synthetic HUI
Options Synthetic HUI
Options
Adam Hamilton
Archives
July 16, 2004
Speculators have always loved
the incredible power and versatility of options, contracts which
grant the buyer the right but not the obligation to buy or sell
a security at a specific price within a finite period of time
in the future.
The strategic use of options
contracts enables speculators to leverage their exposure by buying
additional risk or reduce their exposure by selling their existing
risk to other willing buyers. Options render speculative markets
far more efficient by facilitating the transfer of risk from
the risk adverse to those most willing and able to accept it.
The most well-developed options
market on the planet today is based on the QQQ exchange-traded
fund, the famous NASDAQ 100 tracking stock. Vast volumes of QQQ options
trade each day, with almost unfathomable amounts of risk being
transferred from hedgers like mutual funds to speculators like
hedge funds. The instant liquidity provided by the QQQs and their
options has made the tech sector the most trader-friendly market
in existence.
Since this tech sector remains
so popular even after the trillions of dollars lost when its
bubble burst,
it continues to dominate financial-market innovation. Other less
popular sectors including gold stocks have lagged behind significantly.
This presents a challenge to speculators trading in these secondary
sectors that have not yet won popular acceptance and lack the
extraordinary liquidity of the tech sector.
Although still overlooked by
the general populace, gold-stock performance has blown the doors
off technology in recent years. From March 2003 to January 2004,
the ever-loved NASDAQ Composite ran up 69%, certainly a very
impressive cyclical-bull
run. Yet, when compared to the HUI unhedged gold-stock index,
the flagship index of the precious-metals sector, the NASDAQ's
performance looks downright pathetic.
Over roughly the same time
period, from March
2003 to December
2003, the HUI rocketed up by 125% in a spectacular upleg
almost doubling the NASDAQ's winnings. Yet few realize
this since the gold-stock bull remains largely under the radar
of major financial-news outlets like CNBC. From its stealthy
launch in November
2000, the HUI's bull-to-date gains are weighing in at a jaw-dropping
614%! Talk about a bull market, wow!
Naturally an accelerating bull
of the magnitude of the HUI's is a paradise for speculators.
We have already been blessed with enormous winnings so far in
this bull and odds are the best is yet to come. In my case personally,
and many of our newsletter
subscribers, most of the profits won so far have been in
trading actual elite unhedged gold stocks including many of the
HUI index components. Carefully timing these individual stocks
will remain the foundational core of our bull-market strategy
going forward.
Yet, it is nice to augment
a speculative gold-stock portfolio with even higher-risk higher-leverage
plays. The four major HUI uplegs to date have averaged 111% gains
each, not bad at all. Speculators, while probably quite
content with the lion's share of their portfolios reaping these
kinds of gains, are always looking for higher-octane trades for
the smaller high-risk portion of their capital. Why not take
your most speculative pool of capital and shoot for doubling
or quadrupling the HUI's upleg gains?
Traditionally this has been
done by speculating in junior gold stocks, small unproven ventures
that are not actually mining gold yet. The fascinating realm
of juniors is extraordinarily risky though. These juniors have
no profits and hemorrhage cash faster than a sieve, so they rely
on the capital markets for financing and a lot of luck to attempt
to find bonanza-type properties to mine or sell. Many remind
me of dot-coms of the late 1990s, blue-sky ventures built on
nothing but dreams.
If you are fortunate enough
to pick a junior that strikes it big, 100x+ returns are possible.
Unfortunately the vast majority of unproven junior miners eventually
fail and their shareholders lose their capital. Unless you are
a mining geologist with inside knowledge of particular companies'
exploration projects, junior miners are essentially a crapshoot.
In addition, juniors are almost always actively gamed by unscrupulous
promoters and pump-and-dump schemes are rampant in this hyper-risky
arena.
An alternative strategy for
leveraging HUI uplegs, and even corrections, is using options.
HUI options are nowhere near as risky as junior-mining speculation.
To use HUI options to win big all you have to do is roughly
time major uplegs in gold stocks and then buy call options
as a new upleg gets underway. This is a pure macro analytical
exercise that is far easier than trying to guess which of 25
Canadian exploration companies is most likely to strike it big
in the next six months.
So let's say you expect the
HUI to trade above 280 by Thanksgiving, up from 200 today. You
could buy a HUI December 220 call option for $15 or so. If the
HUI does indeed hit 280 before your December expiration, your
$15 option will be worth $60. A modest 40% HUI upleg would be
leveraged up into an impressive 300% gain via HUI options. Naturally
HUI puts could also be used to leverage the inevitable
corrections following these uplegs. Sounds easy, right?
In theory it is, but in reality
it is not because the HUI options market is a steaming pile of
trading manure. Unlike the hyper-liquid QQQ market, today's HUI
options market is a joke. The custodian of the HUI Gold BUGS
(Basket of Unhedged Gold Stocks) Index, the American Stock Exchange,
has failed miserably in running the options market for the HUI.
HUI options volume is virtually nonexistent today due to the
AMEX dropping the ball on two major issues.
First, the AMEX decided to
make the HUI options follow the European expiration model as
opposed to the far superior American model. European options
are only exercisable on one single day, expiration day.
American options may be exercised at any time between
purchase and expiration, providing far more flexibility. This
decision provides a huge psychological disincentive to HUI options
trading.
Because speculators willingly
accept big risks, they do not want any artificial limitations
on their positions. Even though European options can be traded
anytime, the restrictions on exercise tend to spook speculators
and lower the perceived value of the options contracts. Speculators
accustomed to trafficking in American-style options generally
want nothing to do with restricted European options regardless
of if they actually plan to exercise or not.
Second, since there is no HUI
exchange-traded fund like the QQQs, the HUI options are not tradable
within a normal options-enabled stock-trading account. This greatly
limits their popular appeal since most gold-stock speculators,
the primary market for the HUI, are not interested in dealing
with all the hassles of opening and maintaining a separate futures-options
account. The QQQ options have become so popular partially because
they can be traded within a normal options-enabled stock account,
with no futures broker or infrastructure necessary.
With unnecessary expiration
restrictions and no availability through standard stock-trading
channels, the existing HUI options are about as popular as Michael
Moore at the White House. And if you examine a December options
chain you can really tell. As I am writing this essay, the biggest
open interest in December in any HUI options is 130 contracts,
virtually zero. Just one of the dozens of December QQQ options,
however, has an open interest of 75,201 contracts alone!
While actual HUI options in
their present incarnation have sadly proven to be a dismal failure
even during the greatest gold-stock bull in decades, I have long
been pondering the concept of synthetic HUI options. In
this context a synthetic option means another financial-market
instrument that closely mirrors the way HUI options would
behave if they were modeled after the extremely successful QQQ
options market.
What if there was an existing
option that was American style with unrestricted rights to exercise,
that could be easily traded in any options-enabled stock account,
that is well-developed and very liquid, and that very
closely tracks the HUI? Amazingly enough, there is!
Rather than grumbling at the AMEX for totally botching real HUI
options, we can trade synthetic HUI options almost as good as
the way the HUI options ought to be.
Like the NASDAQ 100, the HUI
action is derived from that of its underlying component companies.
While the NASDAQ 100 has 100 member companies, the HUI has 16.
The gold-stock universe is much smaller than the tech-stock universe
which makes it far more responsive to new speculative-capital
inflows. $10b chasing tech stocks is trivial, but the same $10b
buying gold stocks is a big deal.
In the NASDAQ 100, the single
largest component by market capitalization is the mighty Microsoft.
MSFT is directly responsible for about 8% of the movement of
the NASDAQ 100 and its QQQ tracking stock. The top 10 NASDAQ
100 companies account for 40% of the index's weight and movement,
effectively dominating its trading behavior.
In the far more concentrated
HUI, the top 3 component companies alone account for almost 40%
of the index's weight and movement. American giant Newmont Mining
takes the pole position, commanding over 15% or almost 1/6th
of the HUI's entire weight. It is followed by South Africa's
Gold Fields at 14% and Freeport McMoran Copper & Gold at
just over 10%. None of the other 13 components even exceeds 6%,
so these three companies truly dominate the HUI.
Thus Newmont, Gold Fields,
and Freeport are like the Microsoft, Intel, and Cisco of the
gold-stock world, influencing their sector more than all other
stocks combined at times. Of these three companies, only one
precisely tracks the HUI however. This company, Newmont, already
has a thriving and liquid options market which acts just like
synthetic HUI options. Before we delve into this concept though,
let's eliminate Gold Fields and Freeport McMoran as exceptional
HUI proxies.
Gold Fields is a great South
African company I have owned during past uplegs and been blessed
with big wins on, but it does not track the HUI precisely for
a couple major reasons. First, in recent years the Marxist government
of South Africa has grown bolder in its anti-capital rhetoric.
It has passed laws designed to confiscate portions of South African
gold mines from their lawful owners.
And even if you can overlook
the scourge of Marxism, stealing from the industrious to subsidize
the lazy, South African mines are hurting due to soaring costs
in their local currency the rand. As the US
dollar bear continues, naturally the rand is rising. Along
with the rand, all of the costs of mining for South African mines
go up as well. Since this current gold bull is primarily a dollar-weakness
phenomenon so far, the gold
price in foreign-currency terms has been far weaker hurting
non-dollar-centric mining operations. Thus the South African
miners are not tracking the HUI closely these days.
Freeport McMoran is another
very impressive company, but it is a primary copper miner.
In 2003 54% of its revenue was from copper sales. It did
mine 2.5m ounces of gold and 4.1m ounces of silver, but for Freeport
these are largely byproducts from its massive copper mining operations.
While Freeport is a fine company, many HUI purists, including
I, believe that it should not be included in the HUI since
it is not a primary gold miner. Needless to say, Freeport's trading
action is far more sensitive to copper prices than gold prices.
With two of the top three HUI
companies eliminated as synthetic-HUI-options candidates since
they don't track the index close enough, that leaves Newmont
Mining. Denver-based Newmont is the largest unhedged gold miner
on the planet, producing 7.4m ounces of gold in 2003. In addition
to dominating the HUI, it is also the only pure gold miner included
in the flagship S&P 500 stock index. This visibility outside
of the gold world greatly improves its liquidity and helps ensure
it has a thriving options market.
Due to its market dominance
and S&P 500 exposure, Newmont's options chains sport the
highest trading volume in the gold-stock world. While the largest
December open interest in any individual HUI contract was only
130 contracts, just one of NEM's December options already has
an open interest of 5,247 contracts, or 40x as much. And regardless
of which expiration month you investigate, total NEM options
open interest always runs in the thousands or even tens of thousands.
Now a thriving options market
alone does not necessarily make Newmont an ideal synthetic HUI
option foundation. Options pricing is primarily based off of
volatility, so we have to compare the underlying volatility of
NEM to that of the HUI. In addition, if we are going to use NEM
as an options proxy for the HUI, we have to be darned comfortable
that it tracks the HUI very closely.
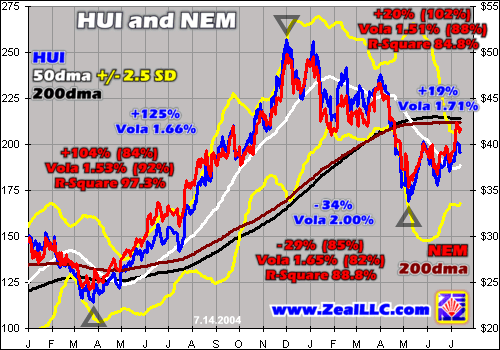
Our first chart this week addresses
these crucial issues. It is a graph of Newmont superimposed over
the HUI. Running from early 2003, this time frame provides an
excellent baseline comparison since it encompasses the latest
full upleg and the latest full correction in the gold-stock world.
Gray fulcrums denote these major short-term trend changes dividing
upleg from correction.
We statistically analyzed each
major upleg and correction and noted these numbers on the chart.
Blue numbers apply to the HUI and red numbers to NEM. The first
number is the gain or loss realized during each individual upleg
or correction. Right under this is the average absolute
interday volatility attained during each major swing. Finally,
the square of the correlation coefficient between the HUI and
NEM is noted for each upleg or correction to get a hard mathematical
correlation.
In Newmont's case, additional
percentages within parentheses are included after these base
numbers. These illustrate just how closely Newmont followed the
HUI. For example, if the HUI had average volatility of 1.00%
and NEM had average volatility of 0.75%, then NEM's volatility
would be running at 75% of the HUI's with this number recorded
in parentheses.
As this graph clearly illustrates,
NEM's trading so closely follows that of the HUI that it is just
uncanny.
Before we delve into the underlying
math for hard comparability purposes, please sit back and drink
in this chart visually. The parallels between HUI and NEM trading
are really extraordinary. As a matter of fact, if this graph
wasn't labeled I think we would all be hard-pressed to tell which
series was the HUI and which was NEM. Without the axes it would
be really easy to pass off the NEM graph as that of the HUI and
practically no one could tell the difference. The strict degree
to which NEM visually mirrors the HUI is remarkable.
But options trading is a statistically-intense
numbers game. A visual correlation implies an actual mathematical
correlation, but the precise degree of conformity is not known
with certainty until some rudimentary statistical analysis is
performed. We will concentrate on three areas for this analysis,
the magnitude of major moves, the actual interday volatility,
and the r-square correlation value of these two data series.
In terms of magnitude, NEM
options will only make good HUI synthetics if NEM moves in a
similar percentage range as the HUI. In last year's major upleg,
the HUI ran up 125%. NEM's own upleg followed closely behind
weighing in at 104% before it gave up its own ghost in early
December. 104% divided by 125% (and rounded) indicates that NEM
had 84% of the range of the HUI in the 2003 upleg. This is great
news because in order for NEM options to mimic what HUI options
ought to be it has to have similar major swings within its own
secular bull.
In this chart one full upleg,
one full correction, and the early months of the next
major upleg are shown. During these three episodes the full
range of NEM ran 84%, 85%, and 102% of that of the HUI. If we
average these numbers we get a 90% result. This reveals that
the Newmont stock underlying the NEM options is swinging through
90% of the range of the actual major HUI uplegs and corrections.
90% of the HUI's range magnitude is plenty high and definitely
passes muster for synthetic HUI options!
After the range of the major
swings, volatility is also a very important factor to consider.
Options pricing is primarily based on volatility. If the HUI
and NEM don't have comparable volatility profiles, then the pricing
of NEM options will be out of whack with what true HUI options
ought to be and it will be far more difficult to profitably trade
the major HUI swings via NEM options. Thankfully, NEM volatility
matches the HUI's very well.
In the 2003 upleg, the HUI's
average absolute interday volatility ran 1.66% compared to 1.53%
for NEM. Thus, NEM had 92% of the daily volatility of the HUI.
If we average all three of these major swings, NEM's volatility
ran at 87% of the HUI's on average. With NEM commanding a volatility
profile roughly 7/8th as volatile as the HUI's itself, the pricing
on NEM options should be very comparable to what true HUI options
would be. This is also great news and very encouraging.
Finally, we need to confirm
our visual comparison via statistical correlation. These numbers
were particularly fascinating to me. During the massive 2003
HUI upleg, NEM had such a high correlation with the HUI that
its correlation coefficient squared, the all-important r-square
value, was 97.3%! Since a value of 100% means that the HUI and
NEM always move together all the time and the behavior
in one fully explains that of the other in mathematical
terms, 97% is extremely high.
If we average the r-square
values across all of these major swings, we get a still impressive
90% result. Thus, since early 2003 90% of the movement in NEM
was directly attributable and explainable by the movement in
the HUI, and vice versa. In statistical terms the HUI and NEM
have been trading as if they were one. The actual correlation
numbers empirically verify our visual sense that these two data
series are amazingly alike. Interestingly as well, the longer
the period of time analyzed the higher the r-square, as the three
regions of this chart indicate.
In light of this hard statistical
evidence, it is exciting to realize that NEM options are
essentially synthetic HUI options! Since NEM sports 90% of the
HUI's major-swing range, 87% of its absolute volatility profile,
and a 90% r-square value, trading NEM options provides 90% of
the behavior and impact of trading the HUI options directly.
And, unlike the pathetic HUI options, NEM options are highly
liquid, exercisable anytime, and easily tradable via any garden-variety
options-enabled stock account!
Rejoice fellow gold-stock speculators,
for synthetic HUI options with all the best attributes of the
QQQs do exist today! They are just camouflaged under
the stock symbol NEM.
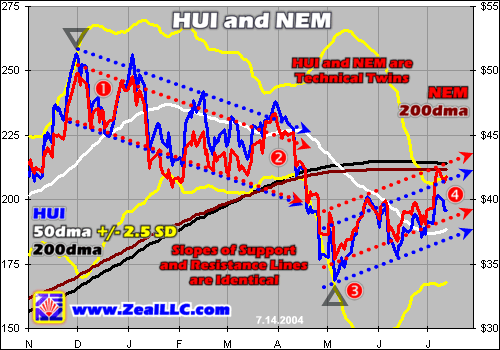
And naturally with such a tight
mathematical relationship the HUI and NEM are also technical
twins over the short term as well. Here we zoom in to just the
latest correction and interim-bottoming phase of this gold-stock
bull market.
While bull markets are driven
by long-term
fundamentals, actual real-time trading decisions are driven
by technicals.
It is fascinating to realize that the short-term trend channels
of the HUI and NEM have identical slopes! The blue and
red lines above representing the most recent tactical HUI and
NEM trends are all parallel. Since the HUI and NEM are technical
twins it makes it fairly easy to make timing decisions on trading
NEM options as HUI synthetics.
For example, at Point 1 above
in early December, the HUI was overbought and due
for a correction. A technically-oriented speculator could
have gleaned this high probability of a pullback by examining
the HUI chart alone. Once our speculator was convinced that a
healthy bull-market correction was probably looming, all he needed
to do to trade his hunch was to pull up a NEM chart.
At the time NEM topped near
$50, so our speculator would consider buying out-of-the-money
NEM puts as HUI synthetics. He might have bought $45 puts on
NEM that expired six months out for $5 a contract or so. And
since he had studied the history of this bull market he knew
that the HUI generally corrects by a third or so after each major
upleg, so he even had a NEM/HUI target in mind.
If the HUI was probably due
to correct by a third, then NEM's pullback should run about 90%
of this or 30%. A 30% pullback from a NEM $50 interim high yielded
a target NEM price of $35. So our speculator knew that if the
HUI corrected, NEM would probably head down towards $35 which
would make his $45 puts worth at least $10. Thus, even if he
paid $5 for these puts, he could have doubled his speculative
capital even during a HUI correction! And all of this trading
could be executed within a matter of seconds from his usual options-enabled
stock account.
And once the correction looked
like it had essentially run its course and a new
HUI upleg was imminent, our speculator could sell his profitable
puts and buy calls. Near Point 3 above, the speculator could
have purchased NEM $40 calls expiring at least six months into
the future. The average HUI upleg in this bull to date has run
up about 111%, and 90% of this yields a NEM upleg target of 100%.
Since NEM bottomed near $35 in early May, a 100% gain in this
stock suggests a potential $70 NEM target level.
If this indeed comes to pass
our NEM $40 HUI synthetic calls would be worth $30 each if this
upleg reaches its expected maturity before expiration. In recent
months we have been recommending and buying these calls around
$3 to $4. The potential leverage obtainable using NEM options
as HUI synthetics to ride the major uplegs and corrections is
just breathtaking!
See the beauty in this? A
gold-stock speculator like you or I analyzes the HUI itself and
games its major uplegs and corrections. Leading into the uplegs
we buy elite unhedged gold stocks but we can also add leveraged
rocket fuel to our speculative portfolio by buying synthetic
HUI calls, trading today as NEM calls. Our portfolio gains are
leveraged to the upside dramatically with the calls and we didn't
even have to take the hyper-risky jump into the turbulent sea
of unproven juniors.
If you are well-capitalized
and can afford the extreme all-or-nothing risks of options trading,
we have already been implementing our synthetic HUI options strategy
via carefully deployed NEM options. The actual trades have been
and will continue to be detailed for our newsletter subscribers
as they happen. We are actively acquiring synthetic HUI options
at apparently opportune moments in anticipation of the next massive
gold-stock
upleg I discussed last week.
These synthetic HUI trades
are detailed as appropriate in real-time in our anytime Zeal
Speculator alert/update service for speculators as well as
once a month in our popular monthly Zeal
Intelligence newsletter. I have been layering in these trades
since April for our subscribers but hadn't yet had the chance
to explain this synthetic HUI options strategy in detail, hence
this essay.
Naturally we will continue
trading and making new recommendations as appropriate in future
editions of both of our newsletters for our subscribers.
Our latest ZI synthetic HUI call was up 47% as of Wednesday,
two weeks after it was first recommended. The profits attainable
in this gold-stock bull are certainly large enough to make even
the most jaded dot-com refugee drool!
The bottom line is even though
the true HUI options market today is a joke, synthetic HUI options
do exist. The elite unhedged miner Newmont moves as one
with the HUI, with similar major swings and underlying volatility
profiles.
Speculators wishing to leverage
major HUI uplegs and corrections with options can substitute
highly-liquid NEM options for the nonexistent HUI equivalent
of the QQQs with a 90%ish effectiveness.
July 16, 2004
Adam Hamilton, CPA
email:
zelotes@zealllc.com
Archives
 So how can you profit from this information? We publish an acclaimed
monthly newsletter, Zeal Intelligence, that details exactly
what we are doing in terms of actual stock and options trading
based on all the lessons we have learned in our market research.
Please consider joining us each month for tactical trading details
and more in our premium Zeal Intelligence
service. So how can you profit from this information? We publish an acclaimed
monthly newsletter, Zeal Intelligence, that details exactly
what we are doing in terms of actual stock and options trading
based on all the lessons we have learned in our market research.
Please consider joining us each month for tactical trading details
and more in our premium Zeal Intelligence
service.
 Copyright ©2000-2004
Zeal Research All Rights Reserved (www.ZealLLC.com) Copyright ©2000-2004
Zeal Research All Rights Reserved (www.ZealLLC.com)
321gold Inc

|