Tactical Gold
Trends Tactical Gold
Trends
Adam Hamilton
Archives
July 9, 2004
After a psychologically-challenging
first half of 2004, gold has gloriously entered the second half
with a dazzling display of strength this week. The Ancient Metal
of Kings is powering higher and extending its bull
market that was quietly born over three years ago. It is
a wonderful blessing to behold!
While it is natural to feel
good this week if you are long the precious-metals complex, it
is still important to temper our emotions as investors and speculators.
Just as gold sentiment darkens after a few down days as fear
rises, sentiment is shining today as greed begins to swell after
a few nice up days. And greed and fear are always counterproductive
and cloud trading judgment.
Day-to-day movements, although
exciting at times, can best be viewed dispassionately by placing
them into their proper context within ongoing price trends. Whether
we witness a depressing string of down days as in early June
or a fantastic streak of up days like this week, daily movements
are really irrelevant in isolation. The true importance of price
action only becomes apparent when considered within the dominant
trends.
In this essay I would like
to discuss these current prevailing gold trends. I am also very
excited about the prospects for gold and gold stocks this week,
but not because we were blessed with some nice daily gains. I
am bullish because the tactical gold trends are undisputedly
positive once again, for the first time since last year, clearing
the way for the next major upleg in gold.
An understanding of these trends
is very important because it trumps day-to-day action and helps
keep investors and speculators on an even emotional keel. Even
if gold had fallen $10 this week instead of surging, leading
to growing fear, the powerful bullish message of these trend
charts would not have changed one bit. They provide the big-picture
framework that keeps the daily swings, both in and out of our
favor, emotionally manageable in their proper context.
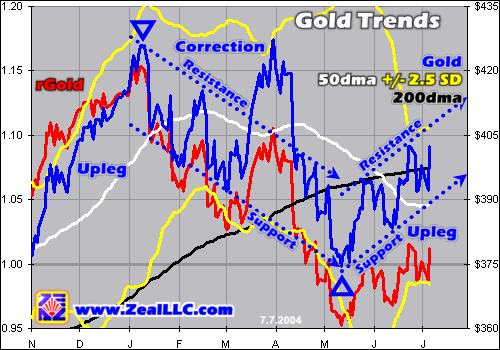
Our three charts this week
detail the current tactical trends in gold, the US dollar, and
gold stocks. Each graph runs back to November and encompasses
two major short-term trend changes marked by fulcrums. The key
50 and 200-day moving averages and 50-day 2.5-standard deviation
Bollinger
Bands are drawn in. Also, each price divided by its 200dma,
the relative
price, is rendered in red on the left axes to normalize the
distance between each price and its key 200dma support or resistance.
Daily market noise aside, these
charts clearly show that the tactical gold trends have become
very bullish and gold appears to be already entering its fifth
major upleg in its bull market to date. Just as in its previous
four major uplegs, I suspect vast profits will be earned by the
prudent contrarians willing to ride gold higher this time around.
Strategically, there is no
doubt that gold is in a primary bull market. >From its lows
near $255 in April 2001 to its highs over $425 in January, gold
has already blasted 66% higher. Even though its long-term trend
driven by global supply and demand remains bullish, over the
short term it advances in powerful uplegs and then inevitably
corrects for a season. Two steps forward, one step back.
These tactical movements are
driven by speculator emotions. When greed waxes too ecstatic
at the top of a major upleg gold corrects, and when fear grows
too overwhelming at the abyss of a major correction gold rallies.
The wave-like nature of tactical trends oscillating around a
strategic trend is a natural market reaction that regulates general
sentiment and self-corrects when either greed or fear threaten
to spiral out of hand.
In this gold graph, greed was
getting silly in early January and a correction
was due. Gold was overbought, gold bears were ridiculed by
the gold community, and irrational predictions about $500 gold
falling within weeks abounded at the time. Greed had simply grown
too great so the gold bull market needed to correct to bring
back a sentiment balance among speculators. This turning point
of the short-term trend, from upleg to correction, is quite evident
above.
Once gold started correcting,
it carved a new tactical downtrend channel during the first four
months of 2004. With the notable exception of the late-March
gold rally, which seemed quite
anomalous at the time since there wasn't a corresponding
inverse move in the US dollar, gold continued to correct and
bleed off greed. In April this dollar-decoupled gold spike promptly
crashed right back down into gold's downtrend channel. These
were not happy times for gold players and negative sentiment
was ballooning.
The longer that this tactical
downtrend persisted, the more negative technical analysts became
and the more fear built up in the gold market. By late April
all kinds of doomsday talk was swirling around gold and fear
was becoming extreme. Dire predictions of gold falling under
$350 and even $300 were everywhere and gold analysts and investors
alike were jumping all over themselves to declare the bull market
in gold over. The gold correction had deftly accomplished exactly
what it set out to do, shift general sentiment from greed to
fear.
By early May, this surging fear was growing so intense that gold
was hammered down to $375 in a final capitulation. Yet, by this
point general fear was as widespread as it was going to get during
a secular gold bull. Provocatively gold fell right down to its
correction support line in May right before rapidly bouncing
higher and never looking back. The prevailing tactical gold trend
had changed back to positive, although no one knew it for certain
at the time.
While we cannot often know
in real-time when a tactical trend is changing, there are all
kinds of signs that let us know to anticipate an imminent trend
change. I was looking for this trend change and wrote about it
extensively in late April, a little early. In "The
Relative Dollar and Gold 2" on April 23rd I concluded,
"Another major gold upleg appears to be on the very verge
of launching, but only the decisive and brave will seize today's
awesome opportunity to saddle up and ride it. Get long now!"
After bouncing one last time
off its correction support line at the capitulation bottom in
early May, gold surged higher off the trend-change fulcrum above.
It ended up carving a pattern well known to technical analysts,
a sharp V-bounce. V-bounces are sharp rallies that follow sharp
capitulation corrections and are a signature pattern that often
marks the birth of major new uplegs or rallies in a market. On
May 28th I
wrote, "Periodic sharp corrections in bull markets are
healthy and expected,
and that is exactly what we have just witnessed in gold stocks."
Yet, even in late May after
the V-bounce appeared on the charts, we still didn't have any
tactical technical uptrend to lean on yet. After the V, gold
struggled with its key 200dma as overhead resistance, which is
not an encouraging sign in a primary bull market when the 200dma
is supposed to act as major support. The short-term 200dma failure
once again spooked battle-weary gold players and gold was sold
again. But then something very exciting happened.
Rather than plummet way back
down to a lower low under $375 and keep its correction downtrend
intact, gold carved a higher low. In the middle of June it caught
a bid again and surged back above the psychologically crucial
$400 level as well as its 200dma, a very important event technically.
It peaked at a higher high in late June and then pulled back
slightly to consolidate its gains.
Now if you weren't paying attention
to the gold charts with a six-month-or-so time horizon in recent
months, it would have been easy to get psychologically buffeted
by all the vacillating trading action. Gold was moving day-to-day
like a jackhammer, taking speculators on a rollercoaster ride
from daily fear to greed and back again. It was enough to make
one queasy! But, during all this seemingly jumbled day-to-day
market noise, an awesomely bullish picture was being painted
on the tactical charts.
From its early May capitulation
V-bounce to its mid-June pullback, gold announced a new level
of support to technically-oriented speculators. A straight line
connecting these two more recent interim lows is drawn above.
A parallel line drawn higher intersects gold's two most recent
interim highs, late May and late June. Together these two ascending
technical lines form an uptrend, a series of higher lows and
higher highs. And this new uptrend is very solid technically
with four major intersects on its pipe walls since early May.
For the first time since last
year when gold was in a major and immensely profitable bull-market
upleg, we are now seeing the early evidence of a new uptrend.
This is very exciting to me as I believe it represents the early
stages of the fifth major upleg in gold! If I am right, then
enormous profits will be earned by gold investors and speculators
in the second half of this year. This new uptrend also drives
the final nails into the coffin of the demoralizing correction
that we suffered through in the first half of 2004.
As you ponder this chart, realize
that this week's price action would have made no difference either
way. If gold had fallen instead of surged, it may have bounced
near its lower support line but the uptrend would still have
been intact. One of the most important reasons for watching the
charts is to keep considering daily price movements within their
proper context to help suppress soaring greed on up days and
welling fear on down days.
Daily price action, when considered
in isolation out of its trend context, is usually meaningless.
It makes no difference at all whether gold is up 1% or down 1%
tomorrow, for example. All that matters is how the next daily
move fits into the existing trends.
This resurgent gold uptrend,
as well as its preceding correction, is intimately tied with
the inverse trading action of its old nemesis the US dollar.
As such, I would be remiss to discuss tactical gold trends without
considering the tactical dollar trends that tend to drive gold
over the short term. The very bullish case for gold is strongly
buttressed by the renewed weakness in the once mighty US dollar.
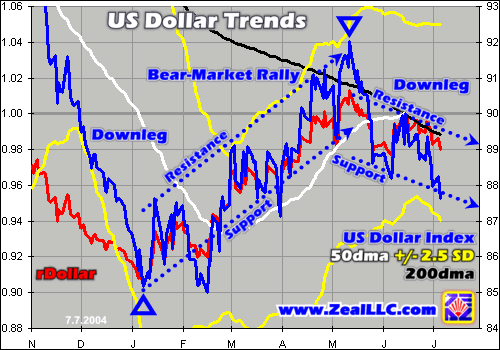
Unlike gold, the dollar is
languishing in a secular
bear market for fundamental reasons. While bull markets oscillate
around their primary uptrend with periodic uplegs and corrections,
bear markets oscillate around their primary downtrend as well.
Naturally, their behavior is inverted compared to bull markets.
If you can, it is useful to view our first gold graph and this
dollar graph side-by-side to fully grasp this important market
truism.
Bear markets' big movements
down are known as downlegs and their periodic countertrend "corrections"
are known as bear-market rallies. Downlegs fall until fear grows
too great at the bottom, then a bear-market rally launches out
of a V-bounce. Once general greed waxes too ecstatic at the top,
the bear-market rally fails and a new downleg begins. Tactical
oscillations within strategic bears are also driven almost exclusively
by speculator emotions.
Just as gold was topping in
early January, the US Dollar Index was bottoming. If you recall
as 2004 dawned, shorting the dollar was considered a surefire
bet at the time and there were just too many people piled onto
the short side. In addition the dollar had been plunging relentlessly
late in 2003 and was very oversold. This stretched dollar condition
provided an ideal spawning ground to spark a major bear-market
rally. The rising prospect for a major dollar rally was the primary
reason I was neutral on gold and expecting
a correction at the time.
Sure enough the dollar surged,
carving a major V-bounce on its chart. Just as in the gold-bull
example above, a V-bounce in a bear market is also a harbinger
of a short-term trend change into bear-market rally mode. The
dollar sputtered a bit initially in February, but then soon started
climbing and created a gorgeous tactical uptrend channel. Its
support was briefly broken on a couple occasions, but on a best-fit
basis the bottom of this trend pipe was still quite solid.
Remember above when I mentioned
the March anomaly in gold? Gold surged in late March but as this
dollar chart shows the dollar did not materially fall at the
same time. This was a cautionary signal that warned speculators
that gold probably had not really reached its correction bottom
yet in early March since the dollar's own short-term trend had
not yet changed. As the dollar surged again in April, gold's
anomalous March spike crashed and ushered in the terribly negative
psychology necessary for a gold capitulation.
The dollar's bear-market rally
peaked in early May, at the exact same time when gold's capitulation
bottom was being carved! Since gold and the dollar are essentially
competing currencies, it is not surprising that they can inversely
mirror each other so precisely at key interim turning points.
If you carefully examine this dollar chart since the May interim
top, you can see why the dollar is confirming a major new upleg
in gold.
In May, just like with gold,
the dollar's tactical trend changed. The dollar started decaying.
Each new high was lower than the preceding one and each new low
was lower. Lower highs and lower lows make a downtrend. The support
and resistance lines for this new dollar downtrend are drawn
in above. The support line has multiple intercepts and the parallel
top resistance line is fairly solid too with one intercept and
three near intercepts. This dollar downtrend is the real deal,
the first since 2003 in tactical terms.
Another point to note is the
dollar is now bouncing off its 200dma as overhead resistance.
The 200dma forms the most fundamental technical support level
in a major bull and resistance level in a major bear. The fact
that the dollar could not hold above its 200dma in May is immensely
bearish and the subsequent failure at its 200dma in June drives
home this point. A new dollar downleg is underway, which is fantastically
bullish for gold.
When both the tactical gold
trends and dollar trends are considered together, the case for
a major new gold upleg brewing becomes very strong. All of the
technical ingredients are now in place for gold to soar into
the second half of 2004, election or not. And if gold does indeed
do us proud with its fifth major upleg in its bull to date, the
primary beneficiary for speculators will be the elite quality
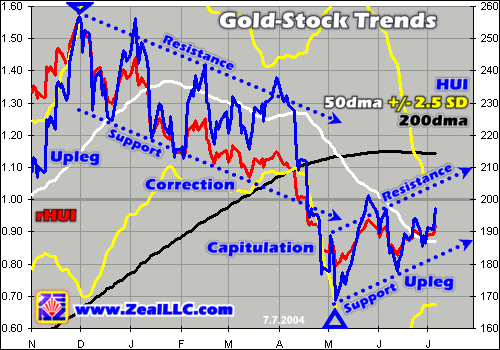
unhedged gold stocks of the HUI.
Interestingly, even the tactical
gold-stock trends have turned bullish as more and more gold investors
and speculators realize how dazzlingly bright gold's fundamental
and technical pictures look today.
Not surprisingly, the HUI's
tactical trend pattern looks very similar to gold's, albeit with
slightly different timing of the fulcrum turning points. Gold
stocks topped in early December 2003 before entering a demoralizing
correction for the next four months to bleed off the excessive
greed of late last year. They failed to confirm the anomalous
March rally in gold as they couldn't carve a marginally higher
high, another warning sign to speculators.
Once the HUI's correction support
line failed in mid-April, an inferno of fear ignited and drove
a brutal capitulation panic. By early May popular fear in gold
stocks was extraordinary, the greatest we have witnessed in this
bull to date by far. At the time I read one report where an analyst
was actually publicly predicting a 90% fall in gold stocks, back
down to below their November 2000 levels when their gold bull
launched! Talk about scary!
Whenever fear reaches these
silly extremes, when all anyone can see is black losses extending
out past the horizon, the markets attempt to balance out this
sentiment overreaction by rallying. And right at the fulcrum
in early May the HUI soared and left a sharp V-bounce on the
charts, once again a telltale marker of a major tactical trend
change. This initial surge failed near the HUI's 50dma, but the
subsequent pullback ended at a higher low, which was encouraging.
The V-bounce bottom in May
and this higher secondary bottom in June formed the intercepts
for the support line of a new tactical uptrend. A parallel top
resistance line only has one intercept so far, but the way gold
stocks are moving this week I don't think it will be too long
at all before a second higher HUI high is achieved and this young
trend channel is fleshed out. And a series of higher lows and
higher highs is exactly what we would expect early in a major
new gold-stock upleg.
From a tactical gold trends
perspective, I could hardly imagine a more bullish way to kick
off the second half of 2004. Gold is carving a new uptrend following
its expected correction, and gold stocks are acting the same
way but a bit more tentatively as most speculators are still
unwilling to believe at this point. It is good to see gold stocks
climbing a wall of worry though as skepticism is normal after
major interim bottoms.
Meanwhile the mighty US dollar,
gold's trading nemesis, has topped out in its major bear-market
rally and is now establishing a new downtrend channel. The primary
beneficiary of dollar weakness in its continuing Great Bear never
fails to be gold. Not only is gold looking good, but the dollar
is looking bad, which is the best of all worlds for gold investors
and speculators.
If you are interested in playing
this growing gold upleg, please consider subscribing to our acclaimed
monthly Zeal
Intelligence newsletter and supporting our research work
at Zeal.
The brand new July issue just
published has our current best-of-the-best elite gold-stock picks
for this upleg, some already sporting double-digit gains. We
are also carefully deploying speculative capital in hand-picked
gold-stock options, the newest of which was already up 35% on
Wednesday only four trading days after I first recommended it
to our clients. If I am right about a new major upleg, then we
have only seen a small fraction of the gains that are coming.
Please subscribe
and get long today!
The July letter, complimentary
to new e-mail subscribers, also discusses potential probable
upleg targets for this fifth gold upleg, both in terms of gold
prices and upleg duration. I also weigh in on the extremely controversial
issue of whether or not gold stocks are likely to be adversely
manipulated leading into the US presidential elections this autumn,
among other topics.
With the tactical gold trends
turning up while the dollar trends decay lower, it sure looks
like another major gold upleg is already underway. For prudent
contrarians willing to heed the early technical signs and deploy
capital before this thing really gets moving, vast potential
profits probably await in the second half of 2004.
July 9, 2004
Adam Hamilton, CPA
email:
zelotes@zealllc.com
Archives
 So how can you profit from this information? We publish an acclaimed
monthly newsletter, Zeal Intelligence, that details exactly
what we are doing in terms of actual stock and options trading
based on all the lessons we have learned in our market research.
Please consider joining us each month for tactical trading details
and more in our premium Zeal Intelligence
service. So how can you profit from this information? We publish an acclaimed
monthly newsletter, Zeal Intelligence, that details exactly
what we are doing in terms of actual stock and options trading
based on all the lessons we have learned in our market research.
Please consider joining us each month for tactical trading details
and more in our premium Zeal Intelligence
service.
 Copyright ©2000-2004
Zeal Research All Rights Reserved (www.ZealLLC.com) Copyright ©2000-2004
Zeal Research All Rights Reserved (www.ZealLLC.com)
321gold Inc

|