|
|||
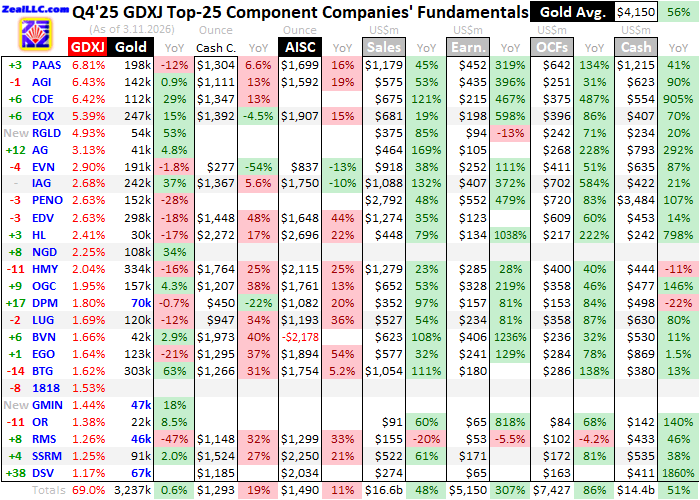
Gold Mid-Tiers' Q4'25 FundamentalsAdam Hamilton Mid-tier and junior gold miners have mostly wrapped up reporting this industry's best quarter ever by far. These smaller gold miners in this sector's sweet spot for upside potential again shattered all records, and again easily bested the larger major gold miners. Last quarter mid-tiers' revenues, bottom-line earnings, unit profits, operating cash flows, and cash treasuries were epic, and amazingly this quarter is tracking better. The leading mid-tier-gold-stock benchmark is the GDXJ VanEck Junior Gold Miners ETF. With $10.6b in net assets midweek, it remains the second-largest gold-stock ETF after its big-brother GDX. That is dominated by far-larger major gold miners, though there is much overlap between these ETFs' holdings. Still misleadingly named, GDXJ is overwhelmingly a mid-tier gold-stock ETF with juniors having lesser weightings. Gold-stock tiers are defined by miners' annual production rates in ounces of gold. Small juniors have little sub-300k outputs, medium mid-tiers run 300k to 1,000k, large majors yield over 1,000k, and huge super-majors operate at vast scales exceeding 2,000k. Translated into quarterly terms, these thresholds shake out under 75k, 75k to 250k, 250k+, and 500k+. Today only four of GDXJ's 25 biggest holdings are true juniors! Their Q4 outputs are highlighted in blue in this essay's table. Juniors not only mine less than 75k ounces per quarter, but gold output generates over half their quarterly revenues. That excludes streaming and royalty companies that purchase future gold output for big upfront payments helping finance mine-builds, and primary silver miners producing byproduct gold. But mid-tiers often make better investments than juniors. These gold miners dominating GDXJ offer a unique mix of sizable diversified production, excellent output-growth potential, and smaller market capitalizations ideal for outsized gains. Mid-tiers are less risky than juniors, while amplifying gold uplegs more than majors. So we've long specialized in the fundamentally-superior mid-tiers and juniors at Zeal, actively trading these smaller gold miners for a quarter-century-plus now. Long ignored by the great majority of investors, the shining mid-tiers are increasingly capturing attention. In 2025 into gold's mid-October peak, GDXJ skyrocketed a phenomenal 161.3% year-to-date! Then they suffered a sharp selloff with their metal in early Q4, with GDXJ plunging 21.6% in under several weeks. But as gold recovered from that same brief rebalancing, GDXJ surged another 38.9% into late December. Interestingly unlike GDX, none of GDXJ's stock-price levels challenged records last quarter. Way back in December 2010, GDXJ had crested at $146.20. That level wasn't finally bested until late January 2026 as gold peaked in extraordinarily-extreme overboughtness. GDXJ's average price in Q4'25 was only $103.33, way under Q4'10's $127.84! Even GDXJ's extreme overboughtness early last quarter wasn't a record. GDXJ soared to 69.5% above its baseline 200-day moving average in early October, which was crazy-stretched. Yet in mid-July 2016, GDXJ had blasted 84.2% over its 200dma! During gold's monster record 139.1% bull run from early October 2023 to mid-October 2025, GDXJ "merely" powered up 262.3%. That made for poor 1.9x upside leverage, way under smaller gold miners' historical tendency of 3x to 4x! After a big-and-fast pullback, gold's epic bull resumed surging into late January 2026 extending its total gains to another record 196.4%! Yet GDXJ "only" rallied 387.9% in that span, still amplifying gold just 2.0x. So despite huge gains, smaller gold miners have still really underperformed their metal! Their stock prices still have big room to rally way higher as more investors discover this sector's phenomenal fundamentals. For 39 quarters in a row now, I've painstakingly analyzed the latest operational and financial results from GDXJ's 25-largest component stocks. Mostly mid-tiers, they now account for 69.0% of this ETF's total weighting. While digging through quarterlies is a ton of work, understanding smaller gold miners' latest fundamentals really cuts through the obscuring sentiment fogs shrouding this sector. This research is essential. This table summarizes the GDXJ top 25's operational and financial highlights during Q4'25. These gold miners' stock symbols aren't all US listings, and are preceded by their rankings changes within GDXJ over this past year. The shuffling in their ETF weightings reflects shifting market caps, which reveal both outperformers and underperformers since Q4'24. Those symbols are followed by their recent GDXJ weightings. Next comes these gold miners' Q4'25 production in ounces, along with their year-over-year changes from the comparable Q4'24. Output is the lifeblood of this industry, with investors generally prizing production growth above everything else. After are the costs of wresting that gold from the bowels of the earth in per-ounce terms, both cash costs and all-in sustaining costs. The latter help illuminate miners' profitability. That's followed by a bunch of hard accounting data reported to securities regulators, quarterly revenues, earnings, operating cash flows, and resulting cash treasuries. Blank data fields mean companies hadn't disclosed that particular data as of the middle of this week. The annual changes aren't included if they would be misleading, like comparing negative numbers or data shifting from positive to negative or vice-versa. Given gold's quarterly-average price soaring an amazing record 56.0% YoY to an epic record $4,150 in Q4, smaller gold miners' results had to prove spectacular. And they certainly didn't disappoint, achieving the best results this industry has ever witnessed! As if all that winning isn't enough, the current almost-over Q1 is actually tracking much better. Mid-tiers and juniors deserve far more popularity than they have.
Last week I did a similar analysis on the GDX-top-25 majors' Q4 results, which are always an important benchmark to compare the GDXJ-top-25 mid-tiers' to. Quarter-after-quarter and year-after-year, smaller gold miners' fundamental performances trounce their larger peers'. With mid-tiers superior on most fronts, there's no reason to bother investing in majors. GDXJ truly should command much more capital than GDX. Yet midweek, GDXJ was only a third as large as GDX. As more speculators and investors start doing their homework and learn how impressively smaller gold miners outperform larger peers fundamentally and technically, this should improve. Mid-tiers deserve way-better capital-inflows growth than majors, which will bid up their stock prices much faster. Q4's GDXJ-versus-GDX results again drove home that point. Last quarter the GDXJ-top-25 mid-tiers produced 3,237k ounces of gold, which edged up 0.6% YoY. That modest growth trailed the global total of mined-gold output in Q4 per the World Gold Council, which climbed 1.1%. Yet it still crushed the GDX top 25's serious 12.0%-YoY shrinkage last quarter! As I explained last week, including a key composition change the majors' production fell a milder-yet-still-worse 5.6% YoY. Majors and mid-tiers have always been fundamentally different. Larger gold miners usually struggle to overcome depletion at the big scales they operate. Yet mid-tiers have littler stables of gold mines than majors, typically running from one to four. So any sizable expansions or new mine-builds really move the needle in overall production. That helps them not only overcome depletion, but generally consistently grow. Production growth is essential in gold mining because it provides the cashflows necessary to continue expanding existing mines and building or buying new ones, ultimately driving stock prices higher. And surprisingly mid-tiers often have lower mining costs than majors, despite the latter's supposed economies of scale. That makes mid-tiers much more profitable relative to their production, supporting bigger stock gains. Also contributing to those is mid-tiers' lower market capitalizations. Last week the average market cap among the GDX-top-25 majors was $38.8b, fully 2.8x larger than the GDXJ top 25's $13.9b this week. GDXJ's top-five components averaged $20.3b, compared to $98.3b for GDX's top five. The smaller any company's market cap, the less inertia its stock price has and the less capital inflows needed to drive it higher. As discussed last week, Q4s are the most-challenging quarters to analyze because of longer reporting deadlines for year-ending annual reports. Some stragglers in the upper ranks of both leading gold-stock ETFs don't publish their Q4 results until mid-to-late March! A key one not reporting until this Wednesday was South Africa's Harmony Gold. It is one of 15 gold miners ranked in both the top-25 holdings of GDX and GDXJ! As a large major gold miner, Harmony's results are important. Since they weren't out yet, they couldn't be included in last week's GDX analysis. But I can add them in retroactively to make the GDXJ-versus-GDX comparisons in this essay more accurate. So realize the GDX numbers cited here vary a bit from those I analyzed last week since HMY was added. Harmony is so big it never should've been included in GDXJ though. Unit gold-mining costs are generally inversely proportional to gold-production levels. That's because gold mines' total operating costs are largely fixed during pre-construction planning stages, when designed throughputs are determined for plants processing gold-bearing ores. Their nameplate capacities don't change quarter-to-quarter, requiring similar levels of infrastructure, equipment, and employees to keep running. So the primary variable driving quarterly gold production is the ore grades fed into these plants. Those vary widely even within individual gold deposits. Richer ores yield more ounces to spread mining's big fixed expenses across, lowering unit costs and boosting profitability. But while fixed costs are the lion's share of gold mining, there are also sizable variable costs. That's where recent years' raging inflation hit hard. Cash costs are the classic measure of gold-mining costs, including all cash expenses necessary to mine each ounce of gold. But they are misleading as a true cost measure, excluding the big capital needed to explore for gold deposits and build mines. So cash costs are best viewed as survivability acid-test levels for smaller gold miners. They illuminate the minimum gold prices necessary to keep the mines running. Last quarter the GDXJ top 25's cash costs surged a hefty 19.1% YoY to a record $1,293 per ounce! The GDX top 25 did outperform here, with cash costs only rising 7.0% to $1,238. A key driver in both of these jumps was royalties, which were explicitly mentioned in a sizable fraction of Q4'25 reports. Since royalty payments are usually structured as percentages of mines' production, they rise along with gold prices. One example came from Lundin Gold, which saw its cash costs soar 33.6% YoY to $947 last quarter. In its Q4 report, LUG attributed this to "the impact of higher accrued royalties and statutory profit sharing payable to employees which were driven by record-high average realized gold prices." OceanaGold pays royalties at three of its four gold mines, which skyrocketed 6.0x in absolute-dollar terms from Q4'24 to Q4'25! All-in sustaining costs are far superior than cash costs, and were introduced by the World Gold Council in June 2013. They add on to cash costs everything else that is necessary to maintain and replenish gold-mining operations at current output tempos. AISCs give a much-better understanding of what it really costs to maintain gold mines as ongoing concerns, and reveal smaller gold miners' true operating profitability. Cash costs are the largest component of AISCs by far. Last quarter the GDXJ top 25's average cash costs accounted for nearly 7/8ths of their average AISCs. So higher royalties naturally boosted the latter as well. In Q4'25 the GDXJ top 25's all-in sustaining costs surged 10.7% YoY to a record $1,490 per ounce. Interestingly that far-outperformed the GDX-top-25 majors, which saw Q4 AISCs soar 16.0% to $1,687! But unfortunately the mid-tiers' impressive cost outperformance is heavily skewed by an extreme outlier. Peru's Buenaventura reported astounding negative $2,178 AISCs last quarter! How is such sorcery even possible? BVN is a polymetallic miner mainly producing silver, copper, zinc, and lead. In Q4'25 its gold production only accounted for 28% of its total revenues despite those dazzling record gold prices, quite low. Buenaventura has always chosen to report in gold-centric terms, crediting all its other metals' production as massive byproducts to gold. This company is really a base-metals miner masquerading as a gold one! BVN's gold AISCs have been really low or negative for nine quarters in a row. BVN was long among the top-25 holdings of both GDX and GDXJ, but has fallen to 27th place in the former as other stocks outperformed. In the 39 quarters of this research thread, I've always included all reported numbers regardless if they are outliers. The vast majority of outlying AISCs over this past decade have been high-side extremes, not low-side ones. So for consistency's sake BVN's must be included whenever it makes the top-25 cut. Without them, the GDXJ top 25's Q4 AISCs would've averaged $1,719 which would've soared 27.7% YoY! But a couple other factors mitigate these record AISCs somewhat. First Hecla Mining and New Gold rank in the top 25 of both dominant gold-stock ETFs. Hecla's Q4'25 AISCs soared 22.4% YoY to an extreme outlying $2,696, dragging up the averages. And New Gold didn't bother reporting Q4 at all, since it is in the process of being acquired by Coeur Mining. NGD's AISCs had been lower, running just $966 in Q3'25. After my quarter-century-plus of intensely studying this sector, I've found the best metric for measuring gold mid-tiers' collective fundamental performance is their implied unit earnings. That simply subtracts the GDXJ-top-25 average AISCs from the quarterly-average gold price. This is way cleaner than bottom-line accounting profits, since a varying GDXJ-top-25 subset's are usually distorted by big unusual noncash items. Last quarter's astonishing record $4,150 gold less those $1,490 GDXJ-top-25 average AISCs yields huge sector profits of $2,660 per ounce! That skyrocketed a stupendous 102.4% YoY, and is the highest ever achieved by either GDXJ or GDX! It easily bested the preceding two quarters' last records of $1,918 and $2,090. And these epic record Q4'25 profits were just the latest in a long trend of phenomenal earnings growth. Over these last ten quarters ending Q4'25, these GDXJ-top-25 implied unit earnings soared 106%, 133%, 63%, 63%, 71%, 95%, 91%, 79%, 82%, and 102% YoY! Has there ever been an entire stock-market sector rivaling such massive persistent earnings growth? With that kind of track record, mid-tier gold miners ought to be among the hottest sectors in all the markets! Investors should be flooding in with a vengeance. And amazingly this epic soaring-earnings streak isn't done. With Q1'26 over 3/4ths finished, gold has averaged an incredible $4,931! Unless gold plummets far lower in the next couple weeks, it ought to exit this current quarter averaging there or better. That quarter-to-date average would make for yet another spectacular record 72%-YoY gold moonshot! That will again wildly outpace mid-tiers' mining-cost inflation. The GDXJ top 25's average full-year-2026 AISC guidance is running much higher at $1,857, which would soar about 35% YoY if Q1'26 shakes out around there. But that is skewed high. It includes a staggering $3,075 from HL, without which the average drops to $1,776. And I've never seen BVN with its really-low-to-negative byproduct-dominated AISCs give outlooks. It will likely continue dragging down the average. But to be conservative, let's assume these elite mid-tiers' Q1'26 AISCs average a lofty $1,850. That still means this current quarter's mid-tier implied unit profits are tracking way up near another dazzling record $3,080! That would skyrocket another 107% YoY, extending this mind-boggling profits-growth streak yet again. And the gold miners will report their Q1'26 results mostly in the first half of May, an auspicious time. Gold and thus its miners' stocks enjoy three major seasonal rallies, autumn, winter, and spring ones. The recently-finished winter one is gold's largest, yet the spring one running from mid-March to early June is gold stocks' biggest really outperforming gold with the best leverage. As long as gold isn't selling off hard, there's usually much gold-stock enthusiasm into late spring. That's right when those epic Q1'26 results drop! Sometimes for various reasons the mid-tier gold miners' hard accounting results reported to securities regulators aren't as glowing as their implied unit earnings. But that sure wasn't the case in Q4'25, which cements the argument it was overwhelmingly gold miners' best quarter ever thanks to record gold prices. The GDXJ top 25's top-line revenues soared 48.1% YoY to a decisive record $16,575m, both utterly-huge! And that and all the rest of these numbers are understated because New Gold apparently isn't reporting Q4'25 with that buyout imminent. These elite mid-tiers' bottom-line earnings under their home countries' accounting rules including GAAP for American ones skyrocketed an eye-popping 307.0% YoY to another massive all-time-record $5,150m! That radically shattered the prior quarter's previous record of $2,900m. As some subset of gold miners often seems to flush through unusual items that can distort profits, I like to back out any material ones. The most-common example over this past decade has been non-cash impairment charges for mines or deposits. In some far-rarer situations, mines' carrying values are written up too. Adjusting for these, Q4'25's GDXJ-top-25 earnings were similar at $5,162m since unusual items largely offset. That still makes for a colossal 252.3%-YoY jump from the comparable adjusted Q4'24 bottom-line profits! Cash flows generated from operations also soared 86.3% YoY to another huge record $7,427m, easily besting Q3'25's previous record of $4,955m. Those gigantic windfall cashflows and profits catapulted the GDXJ top 25's cash treasuries up a massive 50.8% YoY to another record $14,410m. This is all crazy-awesome. While bottom-line earnings are crucial for stock valuations, OCFs and cash on hand directly fund future production growth. Gold miners flush with cash as more floods in are way more likely to invest windfalls in expanding their existing mines, building new ones, and acquiring operating mines from other companies. That should make for faster production growth among smaller gold miners in coming years, which is very bullish. The big risk here is gold. Gold stocks are ultimately leveraged plays on their metal. No matter how great the smaller gold miners' fundamentals are, their stocks will likely amplify any material gold moves by 3x to 4x like usual. In late January gold soared to some of its most-extreme overboughtness ever, the worst since just after January 1980's notorious bubble! After a brief crash six weeks ago, gold has consolidated high. So by all historical standards, gold remains extremely overbought. A half-century-plus of precedent is just screaming for a big-and-fast selloff to rebalance extreme technicals and sentiment. If that indeed comes to pass anytime soon, gold stocks will get hammered regardless of their fundamentals. That would prove a fantastic buying opportunity! Realize that downside risks for gold and its miners are high given these conditions. Successful trading demands always staying informed on markets, to understand opportunities as they arise. We can help! For decades we've published popular weekly and monthly newsletters focused on contrarian speculation and investment. They draw on my vast experience, knowledge, wisdom, and ongoing research to explain what's going on in the markets, why, and how to trade them with specific stocks. Our holistic integrated contrarian approach has proven very successful, and you can reap the benefits for only $12 an issue. We extensively research gold and silver miners to find cheap fundamentally-superior mid-tiers and juniors with outsized upside potential. Sign up for free e-mail notifications when we publish new content. Even better, subscribe today to our acclaimed newsletters and start growing smarter and richer! The bottom line is smaller mid-tier and junior gold miners just reported the best quarter in the history of gold mining! Last quarter's epic record-shattering gold prices fueled record-shattering revenues, bottom-line earnings, unit profits, operating cash flows, and cash treasuries for the smaller gold miners. And this was actually their tenth quarter in a row achieving skyrocketing unit earnings, an epic unparalleled growth streak. And it isn't over yet with gold trending for another phenomenal record current quarter. These amazing and fantastically-resilient gold prices guarantee the mid-tiers will report an even-better Q1 in a couple months. That will further improve their outstanding fundamentals, likely attracting in more investment capital to bid their stocks higher. But if gold sells off big first to rebalance, gold stocks will really amplify its losses. ### Mar 13, 2026 Thoughts, comments, or flames? Fire away at zelotes@zealllc.com. Due to my staggering and perpetually increasing e-mail load, I regret that I am not able to respond to comments personally. I will read all messages though and really appreciate your feedback! 321gold Ltd |