|
|||
White gold or Sugar high?Ron Woods The outlook for gold is better today than it was in 2001 when it ended a 20 year bear market. Gold is a hedge against inept and corrupt government. However this note is not about gold, at least not the yellow metal that is being re-discovered by millions of people around the world as a means of protecting their savings and wealth. White gold refers to Sugar, the stuff in almost everything we drink. Sugar was once called “White Gold”, until the late 18th century sugar was exclusively used by the then “upper class” to demonstrate their status.
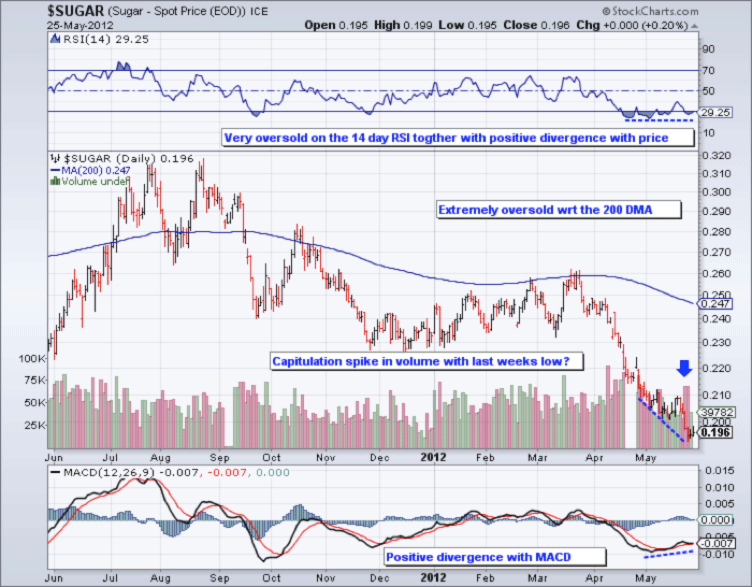
A useful summary of the fundamental case for sugar can be found at Cambridge.org. “Since the eighteenth century, the rise in the per capita consumption of sugar has been closely associated with industrialization, increased personal income, the use of processed foods, and the consumption of beverages to which people add sugar, such as tea, coffee, and cocoa. In addition, the relatively recent popularity of soft drinks has also expanded the use of sugar. Annual per capita sugar consumption is now highest in its places of production, such as Brazil, Fiji, and Australia, where it exceeds 50 kilograms (kg). Consumption in Cuba has been exceptionally high, exceeding 80 kg per capita around the beginning of the 1990s. Subsequently, consumption has fallen to a still very high 60 kg per person. With an annual per capita consumption of between 30 and 40 kg, the countries that were first industrialized in western Europe and North America constitute a second tier of sugar consumers. The poorer countries of the world make up a third group where consumption is low. The figure for China is 6.5 kg, and it is even lower for many countries in tropical Africa. Such a pattern reflects both differences in wealth and the ready availability of sugar to those in the countries of the first group. In the Western industrialized world, concerns about the effects of sugar on health, as well as the use of alternatives to sugar - such as high-fructose corn syrup and high-intensity, low-calorie sweeteners - have stabilized and, in some countries, lowered the use of sugar. Thus, it would seem that further expansion of the industry depends primarily on the poorer countries following the precedent of the richer ones by increasing consumption as standards of living improve. Secondarily, it depends on the ability of the sugar industry to meet competition from alternative sweeteners.” The above 2 paragraphs are worthwhile reading because they nicely summarise the investment case for sugar. Sugar remains one of the few commodities with low consumption per capita in the emerging markets (China and India in particular) Now let’s look at the charts Chart 1 indicates a short-term buying opportunity:
(Click on images to enlarge) Chart 1
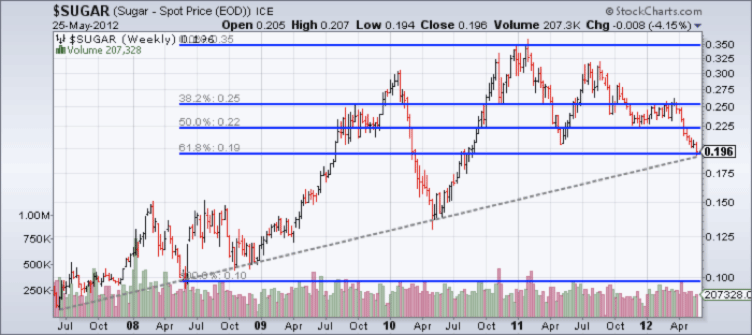
Chart 2 is the weekly chart and shows prices are currently at a FIBO 61.8% retracement of the rally from the 2008 low to the early 2011 peak. Chart 2
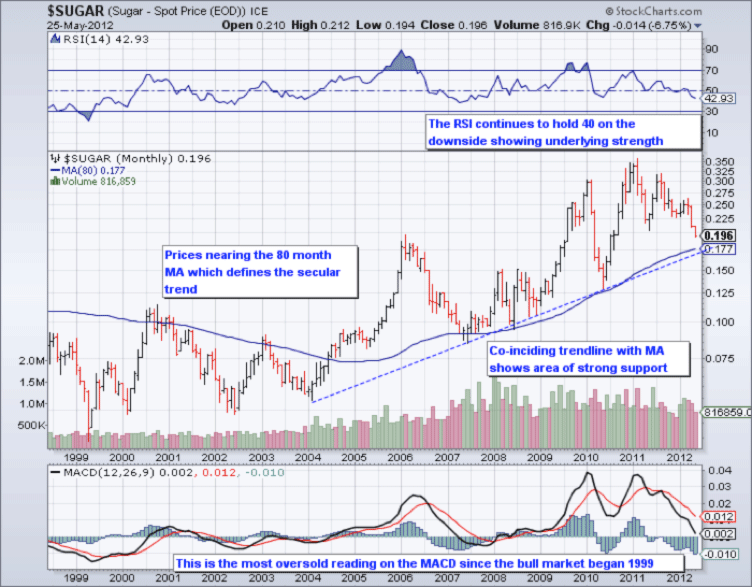
Chart 3 looks at the monthly chart to gain perspective on the big picture and shows prices are fairly close to a major low:
Chart 3
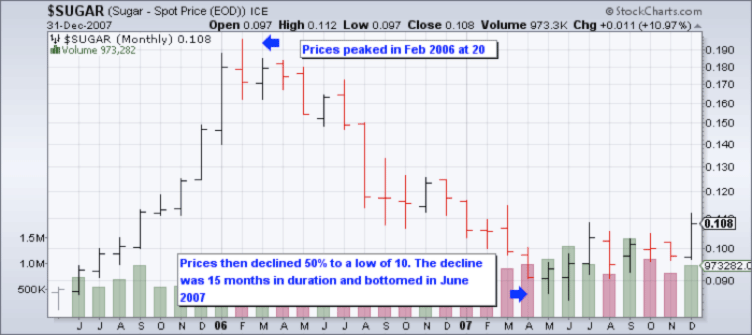
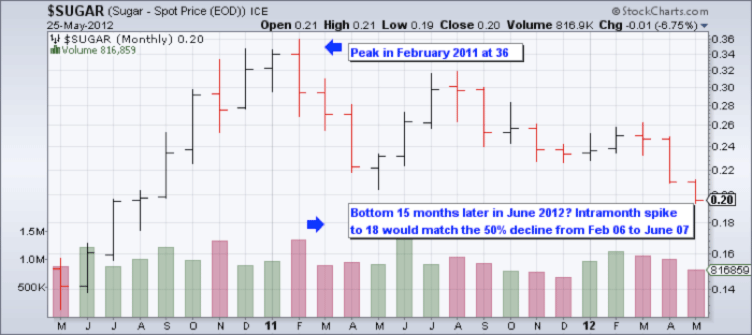
Spot the difference in the next 2 charts: Chart 4 shows the last intermediate correction in Sugar. Prices peaked in February 2006 at 20 and subsequently declined for 15 months to a low of 10 in June 2007. This was a 50% decline in price with duration of 15 months. Chart 5 shows the current correction. Prices peaked in February 2011 at 36 with prices currently at 20. An intra-month low of 18 in June will match the previous intermediate correction of 15 months with a decline of 50%. Chart 4
Chart 5
The fundamentals and technical are both supportive of a rally in Sugar prices both over the short-term and longer-term. Having come to that conclusion we will be patient and disciplined to see the price action unfold that confirms these views before taking a position. This is one for the watchlist. ### Ron Woods Your questions and comments are most welcome. Human emotions are like a pendulum going from extreme optimism to extreme pessimism. Based in Africa, Ron is 39 years old, married with 2 kids. He manages several billion dollars in pension fund assets that are invested across the globe in various asset classes such as cash, bonds, property, equities, commodities and currencies. He is a CFA charterholder and CMT level 3 candidate with 10 years portfolio management experience looking after institutional assets. He did indeed buy gold at THE lows in 2001 and silver at $6. So he has been and remains a bull on precious metals. Copyright © 2012 Ron Woods 321gold Ltd |