| |||
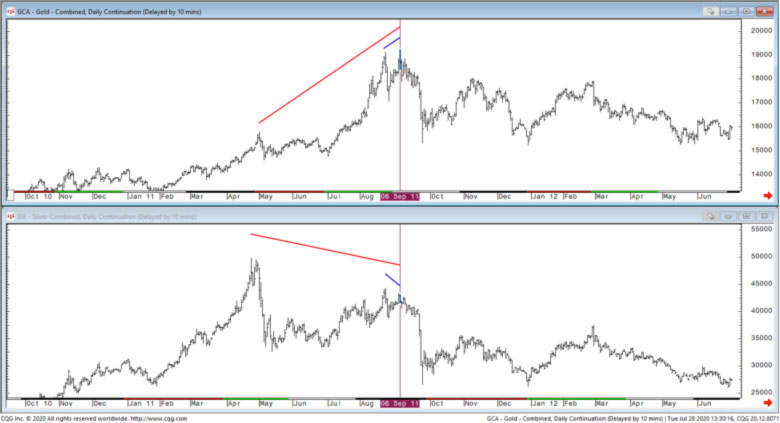
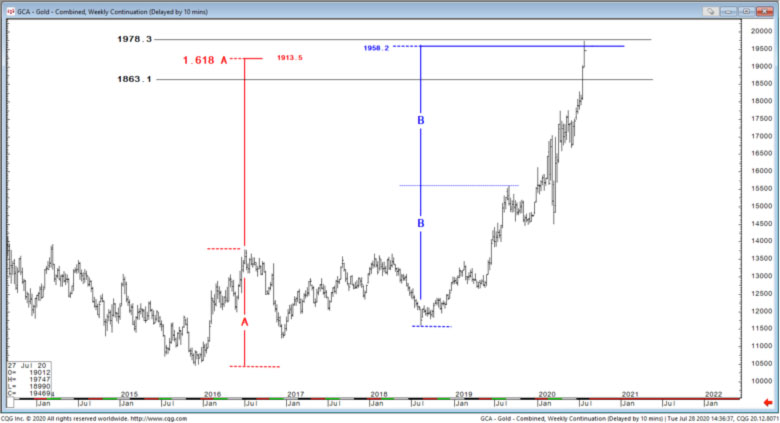
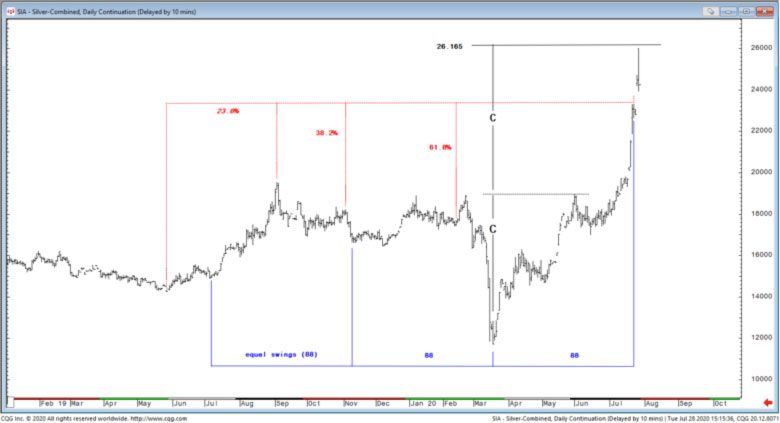
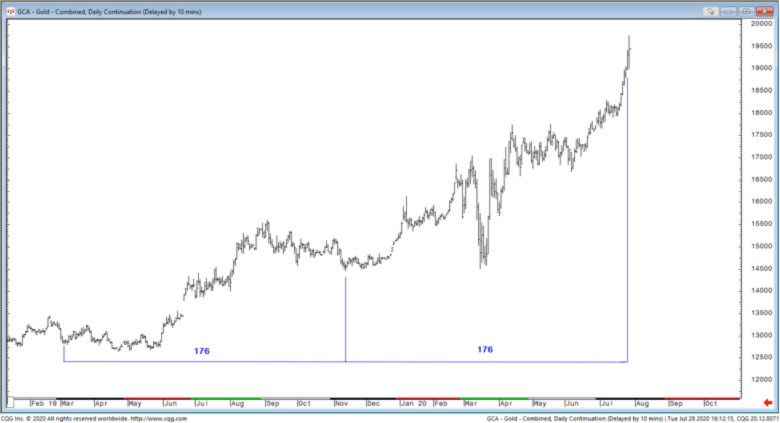
Gold & Silver: Great Action but due for a Pause?Posted Aug 1, 2020 In April and May we wrote two Focus articles on the silver market. Our titles, “Cheap and Due!” and “Deserving Recognition” made the point that the white metal was overdue due to play catch-up with the gold. It had its own technical merits but additionally, the historical extreme in the gold/silver ratio simply deserved heightened attention. Both metals have been recently soaring with the price activity at times vertical on the charts. The ratio has collapsed, not surprising, and for those who have watched silver for many years, prices have been recently in one of those rare “rocket” modes where prices defy gravity. We have no problem with the metals and the strong activity, but we must also not fail to closely gauge activity for any signs that a correction or a pause is due. Because of the new all-time high in gold, we have gone back in time looking for warnings or similarities in 2011 versus today. We found one factor which at this point is not relevant but the older charts did stir up some observations which may one day in the future prove valuable. Our article today from this point will be largely charts and observations. We would like to start with a simple look at gold and silver in 2011. The charts are daily continuations. (Click on images to enlarge) Gold and Silver: Daily Continuation Chart (1) The vertical line representing September 6, 2011 equates with the prior all-time the high in gold. The first factor we note here is that there is a short-term divergence between the gold highs at the top and the silver highs at the same time. We are referring to the small blue lines and a negative divergence where silver fails to make a new short-term rally high. This divergence however pales in importance to the longer and larger multi-month divergence (red lines) between gold moving up to its final highs and silver within the same four-month period failing to make new highs. We cannot count on this happening again but we can relate that the divergence between the two metals occurs often and is highly correlated with market turns in the precious metal prices. It will be something to be watching for in the months ahead. Our next chart is a weekly gold. First, we are basically applying a couple of common expansion relationships to the initial move up in 2016 (1.618) and then (1.00) to the move following the 3- wave rally of 2018-2019. This often provides a reasonable “expected” range: 1913.5-1958.2. Both ironically were achieved today. Gold: Weekly Chart (2) One should also note at the top left side of the chart, the 2 levels of 1863.1 and 1878.3. The normal variance for a double top to that of the previous all-time high in 2011 at 1920.7, would be plus/minus 3% or 1863.1 to 1978.3 The current nearby high interestingly is 1974.7, scored today. On the following page we illustrate a daily chart of silver. Let’s start by noting there is an 88- session harmonic which was due on July 23. It is a couple of sessions late. The chart also shows on the time axis, a large Fibonacci golden section with far more sub-divisions than we ordinarily find. Each correlates with a turn in prices. It was due to terminate late last week. On the price axis we show a doubling of initial move up from the March low to the June high which is the 26.165 level. Today’s spike high is at 26.02. Silver: Daily Chart (3) Before concluding, we show a daily gold chart below similar to the 88-session harmonic on the silver. It is twice as large at 176 trading days and was due to terminate on Monday. Gold: Daily Chart (4) We have identified some factors for the metals with respect to time and price levels. The gold is in the vicinity which makes it a double top candidate and while we expect gold will eventually go higher, this area (plus/minus) we anticipate will be resistance and is capable of starting a correction. Sentiment is difficult to quantify but everything we read is bullish and growing more so. We suspect it is bordering on extreme. A correction of 4-6 weeks would not be abnormal but is not guaranteed. After at least a pause however, the metals have the potential to become candidates for a blow-off. Should that materialize, we need to watch for divergence potential similar to what occurred in 2011. We would also suggest looking over some monthly charts of past bull markets in various commodities and specifically how the last month or two of an accelerated move will display excessively large price ranges coincident with the end. ### Jul 28, 2020 Disclaimer: This information is not to be construed as an offer to sell or a solicitation of an offer to buy the futures or futures options named herein. The information in this report has been obtained from sources believed to be reliable but is not necessarily all inclusive and is not guaranteed as to the accuracy, and is not to be construed as representation by us. The market recommendations contained herein represent the opinions of the author. Such opinions are subject to change without notice. Reliance upon information in this market report is at the sole risk of the reader. Trading in futures and options on futures involves substantial risk of loss and should not be considered appropriate for everyone. Past performance is no guarantee of future performance and it should not be assumed that future profits will match or exceed past profits. 321gold Ltd |