|
|||
Elliott Wave and The Gold Price - Part iiAlf Field Firstly let me repeat some of the comments that I made in the preamble to my previous forecast: "I am not a gung-ho advocate of the EWP. I discovered not only its strengths but also its weaknesses. The EWP does have the tools to provide a magnificent guide to potential future market movements and turning points, these being its major strengths. The weaknesses of the EWP are as follows:
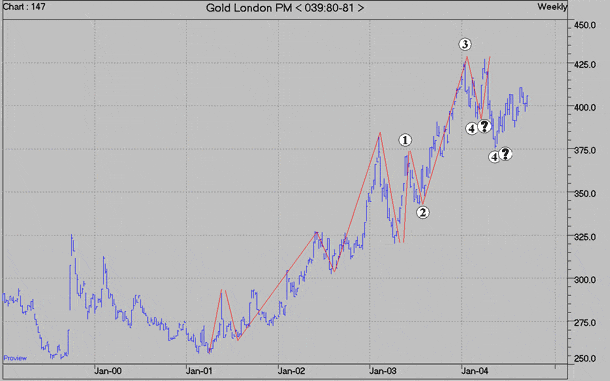
For purposes of this analysis I will use only the London PM Gold fixing prices. In the Futures markets the participants with the deepest pockets can control the market because settlement is invariably in cash. Futures' trading is highly leveraged and the strongest players can push prices around to trigger stop-loss trades by smaller players. In the London gold fixings, to be a seller one must actually have physical gold for delivery and buyers must pay the price in full. The PM fix is the only one where time differences allow both European and North American traders to participate. The PM fix is thus the "real" gold price in my opinion." The nub of my forecast a year ago, with gold at $360 then, was as follows: "A London PM gold fixing above $371 followed by a fix above $382 will enhance the probability of the forecast set out in my analysis above being correct. This would indicate that a move to about $424 without a serious correction was about to occur." The analysis referred to will be reproduced later, but the important element was that from the $424 level, a correction of about 8% to the region of $390/$395 would follow. Thereafter a rapid rise to $500, a correction to $420 and then an extended rise to $630 was anticipated. The following weekly and daily graphs of the London PM gold fixings illustrate what actually happened during the past year:
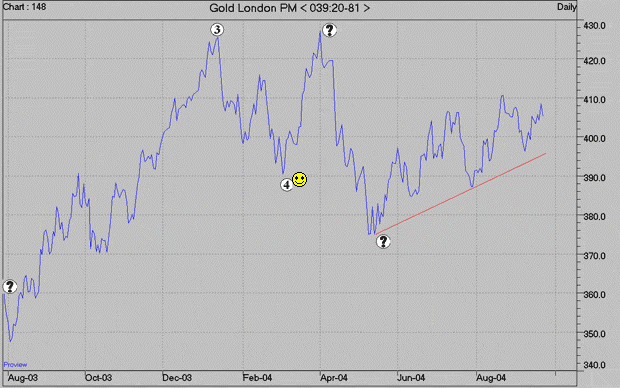
The daily chart of the PM fixing prices shows that once $382 was surpassed a strong rally without a serious correction did occur, as forecast, reaching the point marked 3 on the chart. This was $425.5 on 13 Jan 2004, just $1.50 from the $424 anticipated. The expected correction of about 8% then followed (from $425.5 to reach $390.5 on 3 March 04), which point is marked by the smiling figure at point 4 to illustrate that it was right in line with the original forecast. Gold then started a strong up-move, the question being whether this was the start of the anticipated move to $500. In real time this move looked suspicious because correction 4 was too similar to that marked 2 on the weekly chart. Wave 4 needed to be more complex to meet the EWP principle of alternation. If gold had cleared $430 on a PM fix it would have been convincing that it was headed sharply higher, but it didn't. It stopped at $427.2 on 1 April 04 and then headed south in earnest. The move to $427.2 looked like the B wave of an A-B-C "flat" correction where the top of the B wave is slightly higher than the peak of the previous impulse wave ($425.5 in this case). This should have been followed by a C wave decline of similar magnitude to the A wave decline ($425 to $390, or $35). A decline to the area of $390 to complete the more complex wave 4- correction was anticipated. Thereafter the market should have resumed its upward direction towards $500. Unfortunately the decline did not stop at the $390 area but continued on to reach a low of $375 on 10 May 04. This represented a loss of $52.2 ($427.2 to $375.0) or 12.2%. The low at $375 is marked by a query on the chart, and indeed it is a puzzle because it was a significantly larger decline than the 8% magnitude expected. Yet it was not large enough (16% plus needed) to qualify as the next larger degree of correction. So what happened? What does the future hold? This is where caveat 2 listed above comes into play:
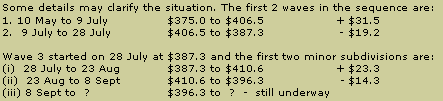
This correction has certainly been difficult to assess. There seem to be two possible outcomes that could emerge. Let's call them: 1.Optimistic; and 2. Pessimistic. THE OPTIMISTIC FORECAST This assumes that the C wave decline from $427 to $375 included an "extended" minor wave that caused the magnitude of the decline to exceed the anticipated 8%. Count the minor waves between the two question marks on the daily gold price chart above and you will find that they total 9 instead of the normal 5. This is a sign that one of the minor down waves itself subdivided into 5 smaller waves, hence the total of 9. Refer to caveat 3 above:
The extended wave included in the decline from $427 to $375 probably caused the increase in the magnitude from 8% to 12%. More importantly, this explanation would mean that the original wave count remains in force and also that the original forecast published on 25 August 2003 is still valid. That leaves the question of what has happened since the $375 low of 10 May 04? The rally is a confusing jumble of movements and we can invoke caveat 4 here:
Bending the EWP rules slightly, it is possible to count the waves since the $375 low as a sequence of first and second waves. The importance of this is that the "3rd of the 3rd", typically the most powerful portion of an impulse wave, is about to start or is already underway. This upward wave should have the strength to reach $430 and beyond, reaching $500 with only minimal corrections on the way.
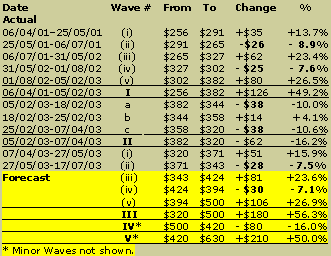
If this analysis is correct, gold is already in (iii) of 3, with the strongest portion of the up-move about to start. To confirm this, we need to see a PM fixing above $410.6 fairly soon followed by a fixing above $430. This would confirm that the entire 2004 correction is finally over and done with. The following longer term forecast
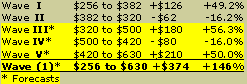
(published on 25 August 2003) remains in force under the optimistic
scenario. No corrections have been made to this analysis: This would leave the analysis
of the larger order of magnitude 5-wave zigzag looking like this: THE PESSIMISTIC FORECAST The bad news in the pessimistic forecast is that there is a possibility of a decline to about $355-$360 before the gold bull market resumes. Confirmation that this alternative forecast is underway would come firstly by a PM fix below the rising red trend line on the daily gold price chart followed by a PM fixing below $396.3 This forecast is based on the possibility that the move from $375 to $427.2 (from the point 4 smiling figure to the top question mark on the daily chart) was a truncated 5th wave. This is the wave that should have zoomed to $500 but was cut off in its prime by either natural market forces or manipulative forces (or both). It did nevertheless achieve a new high, so it is not precisely a 5th wave failure (see caveat 3 again), but it was far shorter than the 5th wave was expected to be. The implication of this is that the 16% correction originally expected from the $500 level in the original forecast must have started from the $427.2 level. A 16% decline from $427.2 gives a target of $359.0, not a happy expectation. This would mean that the 12% decline from $427 to $375 was the A wave of the correction. The rally from $375 to $410.6 counts quite well as the B wave. This should now be followed by a C wave decline. A typical relationship is for the A and C waves to be of equal magnitude. The A wave decline was $52 or 12.2%. If wave C equals wave A, a target of about $358 emerges ($410-$52). Thus both methods point to a target in the range of $355-$360 for the low point. If the Pessimistic Forecast is the one that emerges, it will have implications for the longer term forecast. The final wave V, shown in the original forecast above as rising 50% from $420 to $630, would now become a 50% rise from the approximate $360 anticipated low to a probable peak in the $540-$550 level. This rise should be interrupted by two corrections of approximately 8%. Caution: If a decline below $350 occurs, more serious downside would be possible. SUMMARY
23 September 2004 Comments may be sent to the
author at: ajfield@attglobal.net |