Elliott Wave Gold Update VII
Alf Field
Jun 19, 2006
Last week, if you felt
like the person in the cartoon below, you were probably in good
company. It was a gut-wrenching downward plunge that challenged
the emotions. Relax, there is some good news.

There is also some bad news.
The scenario outlined in Update VI
was voided when the gold price dropped below $610. The declines
have extended to 23.4% in the Comex 2nd month contract ($733.3
to $562.0 = -$171.3) and 21.7% in the London PM fixings ($725.0
to $567.7 = -$157.3). In the cash market in London there was
a brief probe into the $540's, producing a decline of around
25% from the peak levels.
These declines mark the largest correction in the bull market
to date and are in the 20%-25% range that was expected for major
Wave TWO. The logical conclusion is thus that the market peaked
in Major Wave ONE at the 12 May 2006 peaks of $733.3 on Comex
and $725.0 on the PM fixings and is now busy tracing out Wave
TWO. The 20%-25% range was determined by adding 50% to the approximate
16% magnitude of waves II and IV in major Wave ONE. We have not
had a correction of the Wave TWO magnitude in the bull market
to date, so we have nothing historical to guide us and the decline
may be greater than 25%.
The good news is that if the market is indeed in Wave TWO, it
establishes where the gold market is in the Elliott Wave cycle
and, perhaps more importantly, the bulk of the probable decline
has already been seen. In fact, the sizes of the declines to
date are already of a magnitude adequate for Wave TWO, so there
is a possibility that the lows of the correction are behind us.
As Wave TWO is the largest correction of the bull market to date,
it is likely to extend for some further weeks or months and the
initial down move may only be the first wave in a more complex
sequence of minor waves within Wave TWO.
This assessment raises some issues relating to the minor waves
in wave V. These issues will be addressed later. Firstly, let's
look at the overall picture of major Wave ONE.
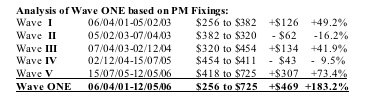
Wave III at $134 is just marginally
larger than wave I at $126 in dollar terms although smaller in
percentages, just sufficient to avoid Wave III being the smallest
impulse wave in the sequence. The analysis of Wave V would now
have to be as follows:
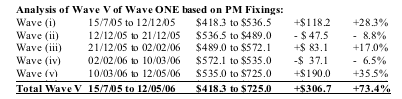
In this analysis wave (iii)
of V is the smallest of the 3 impulse waves, which is a no-no
in Elliott terms and thus casts doubt on this interpretation.
This is one of the issues mentioned earlier and is discussed
below. The PM gold fixing chart now looks like this:
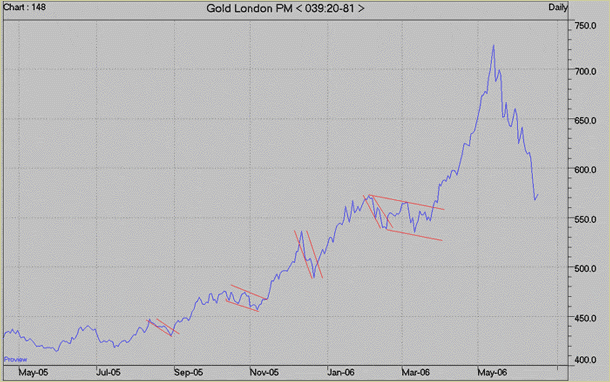
The prior 4th wave of lesser
degree is now the correction in the range from $572 to $535 depicted
between the red lines straddling the $550 level, a common pull
back point, which has been achieved with the fixing at $567.7
on 14 June 2006 and during intra-day trade in London to around
$545 also on 14 June 2006.
I have often been asked how it is possible for an accurate Elliott
Wave analysis to be calculated when the gold market is being
manipulated. This is probably an appropriate time to have this
discussion as the views expressed have a bearing on the issue
of the minor waves being of inappropriate sizes.
At the outset let me say that I believe that GATA has done a
good job in fingering the points of manipulation in the gold
market, although I prefer to use the word distortion. The main
areas where interference with normal market patterns has taken
place are:
- Excessive short selling in
futures markets either to extend a decline or prevent a rapid
upward price thrust;
- Selling of physical gold by
Central Banks;
- Leasing of physical gold to
facilitate hedging or carry trade activities.
It should be noted in points
1 and 3 that for every downward price distortion caused by excessive
short selling there should also be a countervailing upward price
distortion when the trade is unwound. In the case of excessive
selling of futures, these short positions will have to be closed
eventually by corresponding subsequent purchases. Hedging and
carry trade activities are unwound by buying back what was sold
or by delivering newly mined gold back to the Central Bank that
supplied the leased gold, thus reducing physical sales to the
market.
Selling of gold by Central Banks has had the purpose of limiting
the gold price rise. A sharply rising gold price would attract
attention to the rapidly declining purchasing power of the irredeemable
currencies that all countries now issue. This artificial lid
on the gold price will in due course (already happening) attract
the attention of countries accumulating large surpluses, mainly
of US dollars, resulting in purchases of gold for reserve purposes.
In other words, all these distortions tend to be of relatively
short term duration, and are followed by countervailing upward
distortions. The underlying primary trend of the market will
always flow through to be expressed in the major waves while
the distortions will tend to be apparent in the minor waves.
For this reason I have been prepared to ignore areas in the minor
wave counts where Elliott rules are breached and rely more heavily
on the major waves to determine the wave count. For the record,
here are examples of notable distortions apparent in the wave
counts.
- An example of selling extending
a correction: The correction in May 2004 which was expected to
terminate after an 8% decline from $425 to $390 was extended
to $375, a 12% correction, by excessive selling. (Wave (iv) of
wave III).
- An example of an explosive
upside move being halted: In December 2004 the gold price was
roaring towards $500 but was stopped dead in its tracks by an
avalanche of selling at $454. This simply prevented a rapid additional
$40 up-move, which would have been followed by an equally rapid
$40 decline. (Wave (v) of wave III)
- An example of an upward price
distortion taking place is the recent stunning run up to $725.
One would normally have expected this large $190 rise to be caused
by a binge of speculative buying which would have resulted in
Comex open interest zooming. This didn't happen. Open interest
declined, indicating that short covering was driving the price
higher. Similarly in the physical market there were signs of
hedgers covering their positions and central banks accumulating
gold, e.g. Iran.
The following is a comparison
of the original forecast of Wave ONE with the actual outcome.
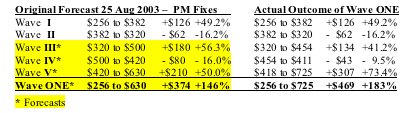
The original forecast back
in August 2003 was made when gold was around $360 and a call
for the peak of wave ONE to be $630 was a bold one. By and large
the major wave forecasts have stood up reasonably well. There
were 2 important distortions, the first being that the peak of
wave III was $454 not $500 as anticipated due to the selling
referred to in example 2 discussed above.
This resulted in the following
corrective wave IV being smaller than the anticipated 16% but
the lows for wave IV were very close to the $420 level forecast.
Wave IV was a triangle that lasted nearly 9 months. The figure
of $411 was the lowest price in the triangle while $418 was the
bottom of the final wave at the apex of the triangle. The second
important distortion was on the upside during the recently completed
Wave V. This is the upward distortion mentioned in example 3
above.
This is an explanation of why
it is possible to ignore some of the inconsistencies in the minor
wave counts. Enough good undistorted data does get through to
enable worthwhile forecasts to be made. As the bull market progresses
and there is a much greater participation in the gold market,
one would expect the impact of these distortions to become much
smaller.
It should be remembered that
gold is unique amongst commodities in that it is produced for
accumulation not consumption. This has important consequences.
In the case of a metal like copper, when demand exceeds supply
and stocks are drawn down to near zero levels, the price will
rise in order to ration the available supplies. A trader caught
short in such circumstances has no choice but to bid up the price
savagely in order to cover the short position. In the case of
gold, most of the gold ever produced is still available in some
form or another. Higher prices thus flush out profit takers allowing
traders with gold short positions to cover more easily than in
the copper example. It also means that corrections in the gold
market can be quite large following very large gains.
Now that we appear to have
reached the peak of major wave ONE at $725 we can make some guesses
as to the peak of the big major Wave THREE which will follow
once the current Wave TWO correction is completed. We now know
that the $725 level is 2.83 times the $256 start of the bull
market. We can project that the peak of Wave THREE will be at
least 2.83 times the low point of this correction. As Wave THREE
could be the strongest of the bull market, it is possible that
the multiple could be higher, possibly 1.618 x 2.83 = 4.58.
If the low of wave TWO turns out to be, say, $545, the recent
intra-day low, the following would be the targets for the peak
of wave THREE:
$545 x 2.83 = $1,542.00
$545 x 4.58 = $2,496.00
The 2 largest corrections during Wave THREE should be of similar
magnitude to the 16% corrections experienced in Wave ONE.
Before we get carried away with the potential of Wave THREE we
need to be sure that the major correction currently underway
as Wave TWO is over. While the decline to date is adequate for
the magnitude expected for this major wave, it is possible that
the first down-leg is only the a-wave of an a-b-c (or possibly
more complex) sequence. It is quite possible that the correction
may absorb several more weeks or even several months.
On a personal note, I will be travelling in China, Europe and
Africa during the next 6 weeks and it is unlikely that I will
be able to produce any reports during this period.
SUMMARY
- The decline below $610 voided
the scenario set out in Update VI.
- The recent plunge has been
the largest of the bull market to date, reaching into the 20%-25%
zone that was expected for Wave TWO.
- The probability is that $725
marked the peak of major Wave ONE.
- The consequence of this is
that there are inconsistencies in the minor waves forming part
of wave V of Wave ONE.
- It is possible that these
inconsistencies and distortions have been caused by deliberate
manipulation of the gold price.
- These distortions relate to
several spheres but downside distortions are eventually followed
by distortions to the upside. Consequently it is possible to
accept that short term minor waves my not accord with classic
Elliott Wave patterns.
- If the low of Wave TWO is
in the region of $545, possible targets for the peak of the strong
Wave THREE to follow could be of the order of $1,542 or possibly
even as high as $2,496.00.
- Wave TWO may have covered
an adequate number of dollars to the downside, but the initial
down wave may only be the a-wave of an a-b-c or more complex
wave sequence. If so, Wave TWO will absorb several more weeks
or months and may exceed the 20%-25% size expected for the current
correction.
19 June 2006
Alf Field
Comments may be directed to
the author at: ajfield@attglobal.net
Disclosure and
Disclaimer Statement: In the interest of full disclosure, the author
advises that he is not a disinterested party in that he has personal
investments gold and silver bullion, gold and silver mining shares
as well as in base metal and energy companies. The author's objective
in writing this article is to interest potential investors in
this subject to the point where they are encouraged to conduct
their own further diligent research. Neither the information nor
the opinions expressed should be construed as a solicitation to
buy or sell any stock, currency or commodity. Investors are recommended
to obtain the advice of a qualified investment advisor before
entering into any transactions. The author has neither been paid
nor received any other inducement to write this article.
321gold Inc

|
