|
|||
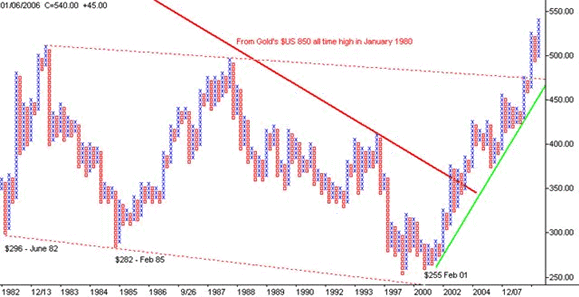
Gold Price ObjectiveAlf Field I regard the following point and figure chart of the gold price as being of extreme importance. It is a 5 point/$5 reversal point and figure chart using only closing prices. That means that only moves of $25 or more are reflected in the chart. This, combined with the use of closing prices only, eliminates most of the froth and "atmospherics" in the market and gives one a clear long term picture of what has happened. This chart of the gold price goes back to 1982 and depicts very clearly the massive quarter-century long base that has formed under the $500 level, from which there has recently been a dramatic upside break-out.  There are various methods of determining price objectives from point and figure charts. In this case I will use the base count. The longer or wider the base, the higher the price objective will be. The method of calculation is to add up the number of columns in the base, multiply by the number of blocks in a minimum reversal and multiply by the value of each block. Then add the top price in the base, i.e. the breakout point. It may sound complicated but it is not. In the chart above the base actually extends further left, prior to 1982, so we cannot get the exact number of columns. There are however at least 150 columns visible, so we can use that as the size of the base. It is a 5 block reversal and each block represents $5, with the top of the base at $500. The calculation is thus 150x5x$5 = $3,750 + $500 = $4,250. This figure of $4,250 is the price objective that can theoretically be achieved over the long term from the support offered by this base. Naturally $4,250 is a long-term target, not something that will be achieved next month or next year. Its great benefit is giving us an idea of what is possible in this new bull market. I believe that the recent break above $500, combined with the changing characteristics of the gold market, are clear evidence that gold is in a new bull market. If we look at the potential peak as being about $4,250 and the start of the bull market being around $250, we can immediately see that only around 7% ($300) of the bull market's upside potential has been exhausted. In other words, this gold bull market is in its very early stages when viewed in this long term perspective. As always there will be downside corrections along the way, some of which may be of scary proportions. It will be important to keep this long term perspective in mind as those corrections will obviously be very good opportunities to increase ones gold and gold share holdings. A shorter term price objective can be calculated from the vertical column that took gold above $500. This column contains 13 blocks which multiplied by $25 gives $325 as the potential upside move from the base of the column. The base price was $460, so the shorter term price target is $460+$325= $785. Another important change that should be anticipated will be in the gold "over-bought/over-sold" and sentiment indicators that have been developed and used over the past 25 years. This was a period mainly of bear market and the early "wall of worry" stage of the bull market. These levels and indicators will be found wanting or will simply fail to give any practical signals as we move into the new bull market. Eventually they will be discarded and new indicators appropriate for the new bull market will be developed. When 90% of people are bullish, the gold price will be above $4,000. Currently only a very small percentage of the financially astute community have any idea of what is happening in the gold market. The wider public have no idea whatsoever about gold, unless they are French or have lived in countries that have destroyed their currencies, such a Zimbabwe. [Editor's note: Clive Roffey has come back with a piece that disagrees with the above analysis, you can read it here.] 13 January,
2006 Disclosure and Disclaimer Statement: In the interest of full disclosure, the author advises that he is not a disinterested party in that he has personal investments gold and silver bullion, gold and silver mining shares as well as in base metal and energy companies. The author's objective in writing this article is to interest potential investors in this subject to the point where they are encouraged to conduct their own further diligent research. Neither the information nor the opinions expressed should be construed as a solicitation to buy or sell any stock, currency or commodity. Investors are recommended to obtain the advice of a qualified investment advisor before entering into any transactions. The author has neither been paid nor received any other inducement to write this article. |
