you are visiting321gold.com
|
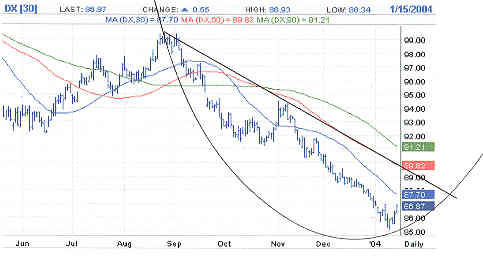
Has gold topped? Has the dollar bottomed?Clif Droke This is the question that gold investors everywhere are asking right now as gold has taken its second sharp decline in the past four months. The U.S. Dollar index, meanwhile, is showing faint signs of life after a nearly relentless decline since its August peak. Is this the start of a prolonged rally in the dollar and a sustained decline in gold? Or is it just another temporary pullback for the yellow metal while the dollar gets a much needed respite before continuing its decline? For answers we must turn to the charts. It's quite revealing to compare the parabolic structure of both gold and the dollar, both separately and comparatively. Below is the daily dollar index chart. The most outstanding feature of this chart is that, despite the immediate-term rally underway, the dollar has bottomed to the right-of-center of the parabolic bowl in the chart. In Parabolic Analysis this is typically bearish, i.e., it suggests a breakdown of the bowl is soon forthcoming. Of course, the most obvious feature of this chart is that a 5-month downtrend line is still very much intact and has not even been tested yet. It currently intersects the 89-90 area and converges with the falling 60-day moving average (direction). The 30-day moving average (momentum) intersects at 87.70 and the 90-day moving average (bias) is also declining through the 91.21 level at present. Thus, the momentum, direction, and bias for the dollar are all still down right now.
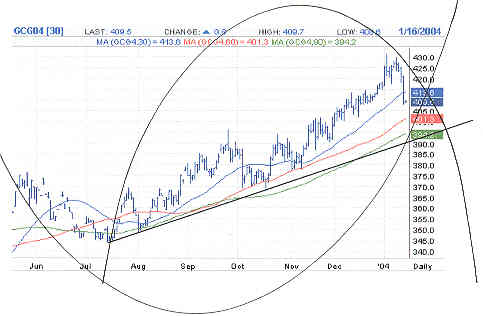
Now what about gold? Has the gold market seen its top? Obviously an immediate-term top was registered recently at the $430 area and after failing to penetrate the outer rim of the parabolic dome in the daily chart (see below), gold was forced downward under this pressure and has slightly penetrated under its 30-day MA. While this action is bearish, immediate-term, the trend and bias for gold are still up. A 6-month uptrend line and a parabolic bowl intersect along with the 90-day moving average at the $394 area, and there is another important psychological support at the $400 area that hasn't been tested. So in my opinion it's still too early for analysts to suggest that gold has "given up the ghost."
Another reason I believe gold will retain its bullish overall position through this correction is that the recent top was too far over to the right-of-center of the parabolic dome pattern shown above. You see, whenever price peaks beyond the "vertex," or mid-point, of a dome pattern it usually translates into a brief, sharp downward correction followed by a reversal back upward and then a continuation of the previous upward trend. This remains to be seen but the odds favor it based on past history. Clif Droke You might want to buy Clif's
new book, Gold
Stock Almanac 2004 |