|
|||
Gold and silver stock review (inc. S.A. shares)Clif Droke The bullion market has been the center of a lot of talk recently as the gold - and especially the silver - price continue to show buoyancy in the face of a rising dollar. Spot gold has held up well of late despite the recent correction, maintaining support above its rising 90-day trend line. Support looks solid around the 90-day moving average area. This is the area near where the rising 90-day moving average intersects in the daily chart along with a very important chart pivot. Although it will likely take several more weeks of consolidation, I expect gold to eventually rally to $480-$500 in the first part of 2006. 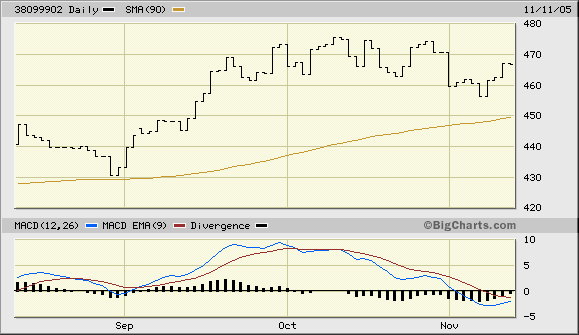 Silver shares have had their share of setbacks in recent weeks, but the lagging prices of some leading silver stocks could easily play "catch-up" in November. One of the indicators worth following to determine oversold and overbought internal conditions in the broad silver stock market in the very near term is the 50-day MA indicator. This indicator is updated each Friday at the end of the week's trading and is simply a measure of how many actively traded silver shares are above or below their respective 50-day (or 10-week) moving averages. For the past five weeks here is how the 50-day MA readings have been. The numbers below reflect the number of silver shares *below* their 50-day moving averages: 10/7: 5 Notice that beginning in early October the number of silver shares below the 50-day MA was a mere five out of about 40 stocks. That almost guaranteed a correction would occur in the silver stock market. But notice that since that time, following the October correction across the board, the number of silver shares below their 50-day Mas each week has since increased markedly. Most recently there were between 15-16 silver shares below the 50-day MA in the past two weeks. Those high numbers of "oversold" stocks usually mean an immediate-term rally can be expected. Among actively traded silver shares, Pan American Silver (PAAS) closed the latest week at $17.12, above its 30/60/90-day dominant interim moving averages. What's important to note is that the 90-day component of this MA series is still up, which is a positive technical indication. I also note that in the daily chart the MACD indicator is also turning up. Wave form analysis suggests that PAAS could commence a tradeable rally in the very near term. The 50-day MA indicator for the 50 most actively traded gold shares also has shown an increased number of gold stocks below their respective 50-day moving averages the past three weeks. Here is how the readings stand for this index for gold shares the past few weeks: 10/7: 8 Among my list of the 50 most actively traded precious metals shares, two made new 10-week highs and two made 10-week new lows on Thursday. The new lows were Golden Star (GSS), which should be near a temporary bottom and oversold rally, and Sterling Mining (SRLM), which also should be nearing a temporary bottom. The new highs included the white metal stocks Inmet (IMN:TSX) and Impala Platinum (IMPUY:OTC). It's always good to see the platinum and palladium group leading the list as gold stocks often follow suit. Among South African shares, our old friend Durban Deep/DRDGOLD (DROOY) announced Friday, Nov. 11 that it is to acquire a 5% stake in Australian Stock Exchange-listed Allied Gold Ltd. For A$3,032,000. DRD also said it had agreed to underwrite a proposed capital raising to be conducted by Allied to raise an additional A$6,968,000 through the issue of 17,420,000 shares at an issue price of $0.40 per share. DROOY's stock reacted favorably to the announcement and was up nearly 8% in Friday trading. 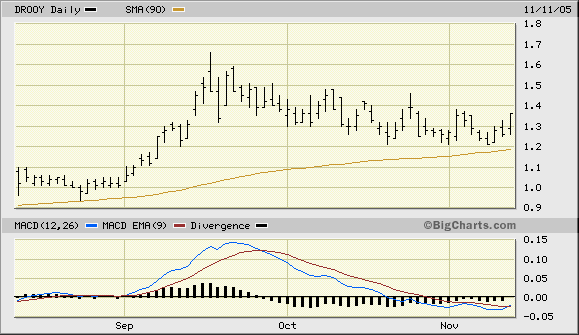 Among low-priced junior mining S.A. shares discussed in a previous newsletter, Wits Basin Precious Minerals (WITM, recent price $0.25) is a rally candidate in the near-term as the share price has already shown signs of reversing after bottoming in October. The October bottom was preceded by a rather pronounced positive divergence signal in the daily MACD indicator - a bullish sign. WITM is now decisively above its 30-day, 60-day and 90-day moving averages and the 30-day MA is in the process of crossing over above the other two moving averages. Conservative upside potential to $0.35-$0.40 before strong resistance begins. 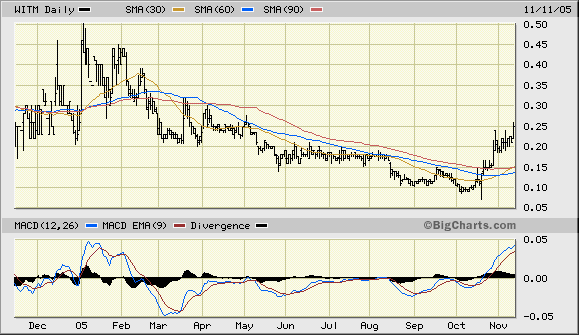 --Clif Droke |
