|
|||
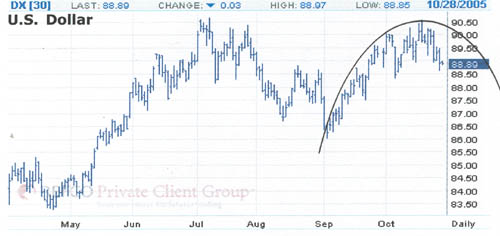
The dollar and the domeClif Droke In an earlier commentary we examined the near-term trend of the U.S. dollar index and saw that its strength from the September low until the mid-October high was most likely temporal based on technical considerations. This observation bears closer scrutiny now that a couple of weeks have passed. Is the dollar still under resistance pressure and headed lower in the near term, or will it breakout to a higher high as we head into November? As always, let's turn to the chart for clues. Earlier this month we pointed out that an attempt at rallying to the 91.00 area in the dollar index would likely be met with strong resistance, and that the dollar's upward momentum from the September rally was fading. The dollar's 10-week moving average was also observed to have been in a less bullish position compared to that of gold. We also drew attention to a developing dome-shaped curve in the dollar's daily chart. Below is the latest update of this parabolic structure in the dollar index graph.  We see here that the dollar index peaked earlier this month at 90.50, which formed the vertex, or mid-point, of the parabolic dome you see in the above daily chart. This dome highlights the overhead supply pressure the dollar is currently facing entering November. This downward pressure is likely to be exerted even more in the next few weeks as several waves of resistance descend upon the dollar index in successive fashion. This is what creates the downward thrust most common with dome-shaped structures as seen in the chart above. Another factor adding to the dollar's downward pressure is the recent spark of bullish sentiment on the greenback. Several financial publications, including one well-known commodities magazine, have featured bullish articles and forecasts on the dollar, with talk of an "inverse head-and-shoulders" pattern becoming commonplace. One magazine cover even featured a depiction of a muscular human arm with the title, "Dollar Strength: Real or On Steroids?" This bullish sentiment is most common at rally tops. In our next commentary we'll view the dollar/gold relationship and what this means for the inflation/deflation outlook in the months ahead. --Clif Droke
|
