|
|||
Gold and the dollar at the crossroadsClif Droke The charts often tell a story that no amount of fundamental analysis can provide. This is because the balance of all the relevant supply and demand factors that influence the trend of prices is already contained in the chart. Right now the charts of gold and the U.S. dollar are at odds as both have recently bucked the inverse relationship they normally enjoy. Is one of the two providing a false signal, and if so, which one? To uncover this let's start with an examination of the intermediate-term trends of both charts.  Currently, the price of gold is butting up against a strong near-term resistance wave at the $480 area and is showing temporary signs of weakness. Part of this is due to the recent upthrust and overextension of the gold price relative to its main trend lines. In other words, the gold price has pulled too far away from its 30-week moving average, for example. But if you look at the daily chart of the gold price you'll see that the three main interim trend lines - the 10-week, 20-week and 30-week MAs - are all rising in a positive configuration. This reflects the strong intermediate-term forward momentum that should succeed in carrying gold through the weak spots of the cycle, such as now. The U.S. dollar index has also been in a rising trend of late. But unlike gold, the 10/20/30-week moving averages for the dollar are not quite as bullish, and wave form analysis suggests the dollar's interim momentum is in the process of fading. In the immediate-term, the dollar may try rallying toward the 91.00 area, a previous benchmark resistance. Notice the potential resistance that begins around 91.00 in the daily chart. Should the dollar succeed in overcoming this benchmark it would likely create a state of exhaustion for the dollar's immediate trend, as "channel busters" usually do. This will allow us to gauge just how much momentum has been lost in the dollar and how big the next downward reversal will be. 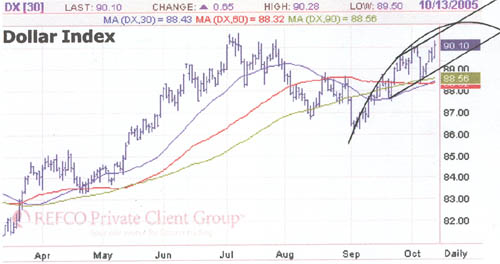 The overall strength within the gold market has been aided by the peak in the 6-year cycle, which has created all sorts of uncertainties for the economy and financial markets. Prior to the 6-year cycle peaking, all the negative events that happened this year (Katrina, et al) were interpreted in a positive light. Biblically speaking, the number six is the number of man, so when the 6-year cycle peaks, so too does the hope and optimism of men and women in the aggregate, i.e., the market. At least that's how I interpret past and present 6-year cycle peaks from the standpoint of market psychology. --Clif Droke
321gold Inc |
