|
|||
How good is your analyst?Peter Degraaf
Have you thought of a good way to rate your analyst? There are currently over 300 financial analysts on the various financial websites, ready to share their wisdom with you and help you decide whether to buy, hold or sell. From letters I have received I can conclude that some of you read everything that anyone is posting on these websites. That's a lot of reading! There has to be a better way - and there is a better way. The only tool you need is a spreadsheet, or a notepad. Whenever you read someone's analysis covering the sector of the market that you are interested in, mark down the specific predictions and expectations that this analyst puts in front of you, especially where dates and prices are supplied. Build up a file on each of the analysts that you now follow. Most financial websites compile an archive of all of the articles published. Go back and read what he or she said in recent months. This is a good way to find out what a particular analyst predicted or concluded in the past. Then be sure and mark it down. After a while put a red "X" on the page of any analyst who was wrong about a prediction 50% of the time or more. Especially mark down any major blunders. Before too long by selecting the prescient analysts and deleting the rest, you will end up with the 'cream of the crop,' and your investment decisions will no longer be made in bewilderment, due to the many conflicting bits of advice that you are currently subjecting yourself to, if you are not being selective. Best of all, you will spend less time in front of the computer, and more time on the beach. It is our custom to always include at least one chart in our essays, and for today we have selected two charts. The first is the index that compares gold to the 30 year bond price. (Chart courtesy Stockcharts.com)  Since late 2002 the trend turned decidedly in favor of gold. The green arrow points to the time when the 50 week moving average rose above the 200 week moving average for 'positive divergence' that is ongoing today. Ever since that day it made sense to sell bonds and put the money into gold. The blue arrow points to the resistance level that has held up the advance since early 2008. Now that gold is rising above $1,000.00 an ounce it is only a matter of time till this index breaks out at 8.5. This will cause many more people to dump bonds and buy gold. At the bottom of the chart we see how closely the trend in the index is tied to the gold price itself. The most bullish development for gold and silver bulls is the knowledge that China is interested in converting some of its huge stash of US dollars into gold and silver. They cannot rush in and buy large quantities because this would drive the price up too high. They have to be content to 'buy the dips'. This puts a floor under both gold and silver and reduces the threat of commercial traders and bullion banks forcing the price drastically lower, as they were able to do in the past. If gold and silver prices were manipulated downward in the past, the end result will be that they will then rise higher than they would otherwise have risen. This is because low prices discourage new production. It takes high prices to entice people to invest in new production. In the case of gold and silver it takes a lot of money and a lot of time before gold and silver can be discovered and brought above ground. 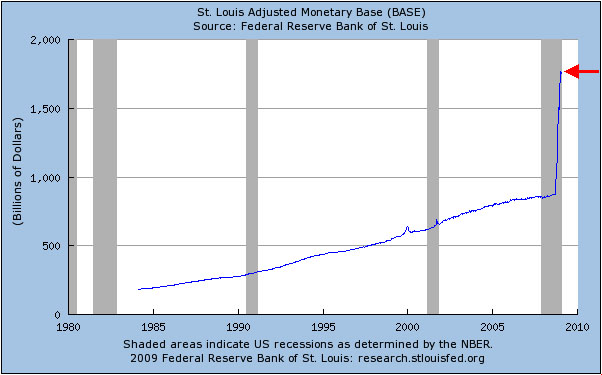 As the chart clearly shows, the printing presses are still working at full speed. Nothing like this amount of currency degradation has ever happened in the USA on this scale before. As long as the rate of mortgage foreclosures remains high, along with a rising unemployment rate, we can count on the Federal Reserve to 'keep on printing.' -Peter Degraaf email: itiswell@cogeco.netPeter Degraaf is an online stock trader with over 50 years of investing experience. He issues a Weekend Report for his many subscribers. For a sample copy, or a 60 day free trial, send him an email: itiswell@cogeco.net or visit his website www.pdegraaf.com. DISCLAIMER: Please do your own due diligence. I am NOT responsible for your trading decisions. -Peter Degraaf 321gold Ltd |
