Gold and Silver "To buy
or not to buy?"
-that is the question
Peter Degraaf
Posted Apr 3, 2009
Historically, and based on
35 years of data, gold usually puts in a bottom in March and
a top in April. We've had the bottom in March (on March 18th),
and we await a top in April.
This top in April usually lasts
for several months, resulting in sideways action with a downward
bias and another buying opportunity in June or July.
The next question is: Can we
count on gold rising to a top in April, or is this a year where
we cannot count on historical data?
(In the case of silver we most
often see a top in May followed by seasonal weakness).
For the answers to our questions
we turn to the charts.
Charts courtesy www.stockcharts.com
and Federal Reserve Bank of St. Louis.
Featured is the weekly gold
chart. The blue arrows point to the bottoming of the 7-8 week
gold cycle. The last bottom came in week #9 and we are currently
operating in week #2. Price on Thursday morning is testing the
multi-month support line. It is at this juncture that people
either step in and buy, or panic and sell out. As long as the
fundamentals are bullish for gold (and they are), then it makes
more sense to buy gold here than to sell gold. The expectation
is that since we are in week #3 of the 7-8 week cycle, gold is
more likely to rise from here than to fall below the support
line.
My Gold Direction Indicator
is registering +72% which is a buy signal. The supporting indicators
(RSI and MACD) are positive.
***
Featured is the index that
compares the gold and silver stocks of the HUI index to the price
of gold. On Wednesday April 1st this index flashed a buy signal,
as price established itself above the 200DMA. A rising trend
in this index is bullish for both gold and gold and silver stocks.
The supporting indicators are positive.
***
Featured is the SLV silver
ETF. The last three times price came near the rising support
line, (including so far on April 2nd), buyers forced the price
back up again (blue arrow). Volume has been declining during
the pull-back which is bullish (green arrow). The RSI is at multi-month
support (horizontal green line), and the 50DMA has just moved
into positive alignment with the 200DMA, which is another bullish
signal.
***
Featured is the chart that
reflects the total bank credit at the US commercial banks. It
reflects the loose policies of the Fed, as the trend is in the
process of going exponential. The aim of the FED is obviously
to push the trend higher. Notice at the top of the chart, some
reluctance on the part of bank credit to keep rising. This reflects
a slowdown in the increase in bank credit despite the Fed's efforts
to force banks to have and make credit available to the market
place. This in turn will cause the FED to pump money into the
system even faster, as they do not want this trend to turn down.
This chart then presents a picture that is bullish for gold and
silver, as it makes a strong case for further accommodation on
the part of the Fed.
***
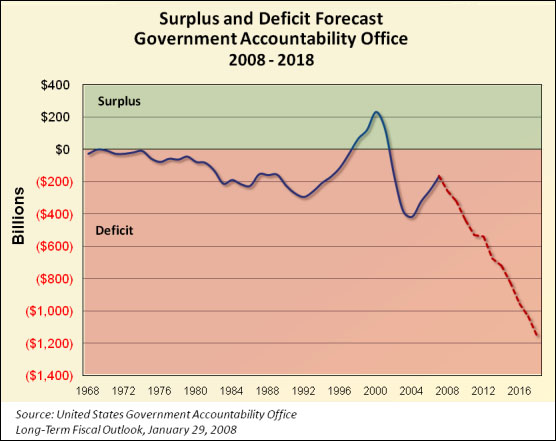
Featured is the chart that
shows the current and projected US government deficits as charted
by the US G.A.O.
Federal deficits always lead
to monetary inflation which leads to price inflation which leads
to commodity inflation (including and especially gold and silver).
***
Featured is the CEF, Central
Fund of Canada. The uptrend is well defined. The supporting indicators
are positive. Volume has been declining during the recent pull-back
which is bullish. Earlier today (April 2nd) I added to my holdings
in CEF by buying at the 50DMA (blue arrow), and I then sent out
an alert to my many subscribers, so they could do the same if
they so desired.
***
Summary:
As long as the fundamentals
for gold and silver are bullish (and they are - current Washington
policies guarantee it), every price dip presents an opportunity
to buy.
During a bull market, every
time price moves near the 50DMA it is an opportunity to buy.
-Peter Degraaf
Peter Degraaf
is an online stock trader with over 50 years of investing experience.
He issues a Weekend Report for his many subscribers. For a sample
copy, or a 60 day free trial, send him an E-mail itiswell@cogeco.net or visit his website
www.pdegraaf.com.
DISCLAIMER: Please do your own
due diligence. I am NOT responsible for your trading decisions.
321gold Ltd

|
