|
|||
Did your analyst keep you invested?Peter Degraaf In November of 2007, while gold was trading at 804.00, I wrote an article titled "Gold and Silver, prepare to back up the truck". (Available in the archived section). At the time a lot of analysts were quoted as saying that gold was 'overbought'. Since then, I have steadfastly advised my subscribers to 'hang in there', except for some partial profit taking (less than 5% of portfolio), at the end of January, and we re-invested that money a few days later with a small profit. Once a week I inform my subscribers, the level at which I am personally invested in resource stocks and bullion. Today it is 99%, (no margin). Please remember that gold is nowhere near the $2,300.00 it will have to reach to equal the 1980 high (adjusted for inflation). Since 1980 there are several billion more consumers on the planet. Many of them reside in India and China, where gold is recognized as a store of wealth and prestige. The middle class in those two countries is growing by leaps and bounds! It has been estimated that the various central banks will need to provide $500 billion dollars of liquidity to the banking system, to save some banks from collapsing. Since the central banks are owned by the banks, you can 'bet your bippy' that this money will be provided. Just as adding water to a glass of milk tends to dilute the consistency of the mixture, so adding liquidity to the world's money supply reduces the value of that money. I wrote an article about 'money' last year that has proved to be very popular, and many readers have told me that they forward this to friends and relatives who are unaware of the current trend of fiat paper money towards zero value. Everybody wants it. Since the middle of the thirteenth century, when Marco Polo returned from China with news of a paper substitute for real money, (such as gold and silver), no paper money has ever retained it's value! It is an interesting fact that every piece of paper with an imprinted monetary value, be it a dollar, euro, franc or peso, has gone down in value against a basket of commodities during the past month, or past 3 months, or past year, or past several years! So before you give in to the temptation of 'taking a profit', ask yourself this question: "What will I do with the money?" The following charts are courtesy www.stockcharts.com  Featured is the 5 year gold chart. Last week the IMF threatened gold traders with a possible sale of 400 tonnes of gold. The resulting price pull-back lasted about a week, and price dropped around 3%. The obvious response of the market was: "Bring it on". ***  Featured is the daily silver chart. Price made the best move of the past year yesterday, the RSI and MACD are positive (green lines), and appear capable of breaking out above the purple resistance lines (blue arrows) thereby assisting price in its rally. *** Next chart courtesy www.kitco.com  Featured is the 5 year rhodium chart. Price moved from $425 to $9,100 in five years. An crease of over 2000%! Traders who sold out at $6,167, hoping for a 50% correction, or even a Fibonacci 38.2% correction, missed out on the rest of the move which is still on-going. Who can tell if silver is not capable of putting in a similar performance? There are those who will say that silver is more critical to our hi-tech world than rhodium. There are a number of commodities that have already moved up a lot more than silver. Silver is still a bargain! *** Next chart courtesy of John Williams (www.shadowstats.com)  Featured is the US M3 money supply chart, as maintained by Mr. Williams. It is currently expanding at almost 16% per year. This is 10 times the rate at which gold can be extracted from the earth. The world's gold supply increases at 1.6% per year. *** The next chart is courtesy of Bud Wood, and is borrowed from a March 22/2004 article by Alex Wallenwein, titled 'Inflation or Deflation' If a picture ever was worth a thousand words, this is it. 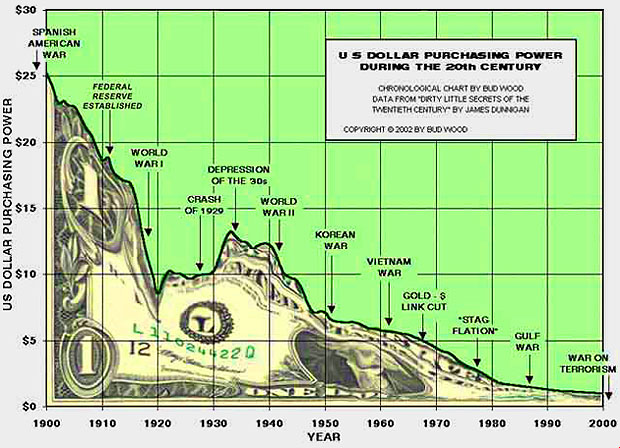 To find the original article, just Google Mr. Wallenwein. *** The last chart is again courtesy of www.stockcharts.com  Featured is the US dollar index. On February 26th price broke down below the four month old support line, heading now for our next target at 72. The RSI and MACD are negative (purple lines), and thus support further slippage in this index. Summary "It was never my trading that made the big money, it was always the waiting". Happy trading! Feb 27, 2008 Peter Degraaf is an on-line stock trader with over 50 years of investing experience. He sends a weekly Email alert to his subscribers. To benefit from a 60 day free trial, contact him at ITISWELL@COGECO.NET or visit his website: www.pdegraaf.com Disclaimer: Please do your own due diligence. I am NOT responsible for your trading decisions. 321gold Ltd |
