|
|||
Gold – Maybe not so much into the Abyss or “Splat Back”!David Chapman
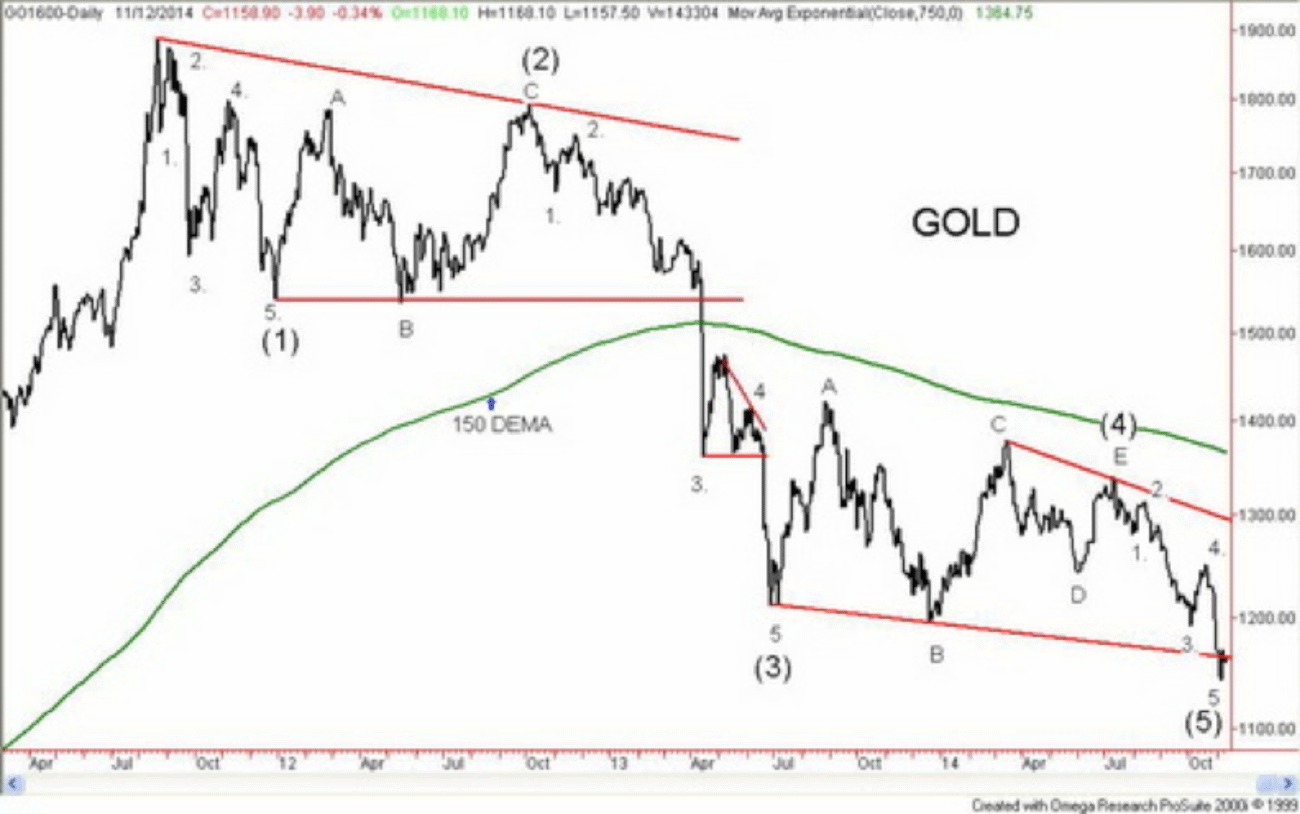
Charts created using Omega TradeStation 2000i. It was only a week ago that gold appeared to be staring into a deep abyss (Chart of the Week – Gold and Oil – Into the Abyss? – November 6, 2014). The dreaded “vomiting camel” pattern appeared poised to “hurl” gold down to $700/$800. While I warned about the potential for “splat back” technical objective calculations projected gold to fall to around $950 following the breakdown under the triple bottom of June and December 2013 and October 2014 just above $1,180. Sentiment for gold, silver and the gold stocks hit record low levels. Who would want to own gold (except the die hards)? Gold has been in a three-year bear market. The reasons for owning gold seemed to have gone the way of the dodo bird (no disrespect meant for the extinct dodo bird). There is no inflation (or at least the Fed or the BofC report that there is no inflation); QE1, QE2 and QE3 had come and gone and the Fed was so confident it ended QE altogether; the US Dollar has been strengthening so who needs to own gold; optimism for the US economy is improving and consumer confidence is rebuilding; and, with an improving economy the Fed might raise interest rates in 2015. The EU and Japan may be going into recession but their problems are “over there”. Gold couldn’t even respond to a fresh round of QE from the BOJ or increased bond buying from the ECB. Even the wars (Russia/Ukraine, Syria/Iraq/ISIS) are over there. So far, it has been a three-year bear market for gold. Gold went through a series of bear markets from 1980 to 2001. The entire period could be considered a cyclical bear market. In between, two intermediate bear markets standout – 1987-1993 (6 years) and 1996-2001 (5 years). By comparison, this one is about equal to previous intermediate bears at least in terms of gold’s decline. The cyclical bear saw gold fall 72%; during the 1987-1993 intermediate bear gold fell 35%; the 1996-2001 intermediate bear saw gold fall 40%. The current bear has seen gold fall roughly 41% so far. As to silver – well silver has fallen roughly 68%. From 1980 to 2001 silver fell 93% although the actual silver bottom was in 1993. When everyone is so bearish maybe it is good time to buy. Last Friday, November 7, 2014 both gold and silver put in a huge upside reversal day. Given that both gold and silver made new lows for the move down and closed sharply higher, the metals made what appeared to have been a key reversal day. That Monday was sharply down and since then the market has largely traded sideways the possible key reversal day has not been negated. The market may well be forming a bull flag or pennant to Friday’s sharp up day (the pole as they call it in technical analysis). With Friday’s big upside reversal day there were numerous pundits instantly declaring the end of the gold bear. While that is possible it is also premature to declare the end of the bear without any hard evidence that the low might be in. There is circumstantial evidence of a possible low of which the upside reversal day is one of them. One piece of circumstantial evidence comes from Elliot Wave analysis and has been noted by The Elliot Wave Theorist www.elliotwave.com. Gold may have completed what appears as five wave down structure from the high of July 11, 2014 at $1,340. While gold broke down from what appeared, as a potential triple bottom with potential objectives down to $950, minimum objectives were around $1,130. The low thus far (futures) was made at $1,133 on November 7, 2014. If that low were taken out then in all probability, the low is not yet in and the $950 objective would loom again. In between potential objectives would be seen at $1,060 and $1,000 with interim support at around $1,100. Regaining $1,180 would suggest that regaining $1,200 is also possible. To help stave off the more bearish scenarios gold regaining at least above $1,225 by year-end would be positive. Positive seasonals could help gold advance. Last year the positive seasonals did not kick in until late December 2013 then gold embarked on a 16% rally into mid-March 2014 (wave C on the above chart). If gold has completed a five wave down pattern from the high of mid-July 2014 gold may also have completed a large five wave down pattern from the 2011 high. Wave (1) down ended in December 2011; wave (2) topped in October 2012; wave (3) made its bottom in June 2013; and, finally wave (4) appears as an ABCDE type triangle pattern that ended with the top in mid-July 2014. If this has completed five waves down from the 2011 top this may only be the A wave of much larger ABC Elliot wave type correction. What would follow would be the B wave up then a C wave down. In terms of length of time they could unfold much faster than the A wave down. Objectives for a B wave up could be at minimum a move to $1,316. A more normal correction could take the B wave up to $1,430 and even as high as $1,614. The B wave would be correcting the entire move down from September 2011. What would follow then would be the C wave down to possible new lows. First, the current $1,133 low must hold and gold must demonstrate that it can go higher by at least closing over $1,225 by year-end 2014.
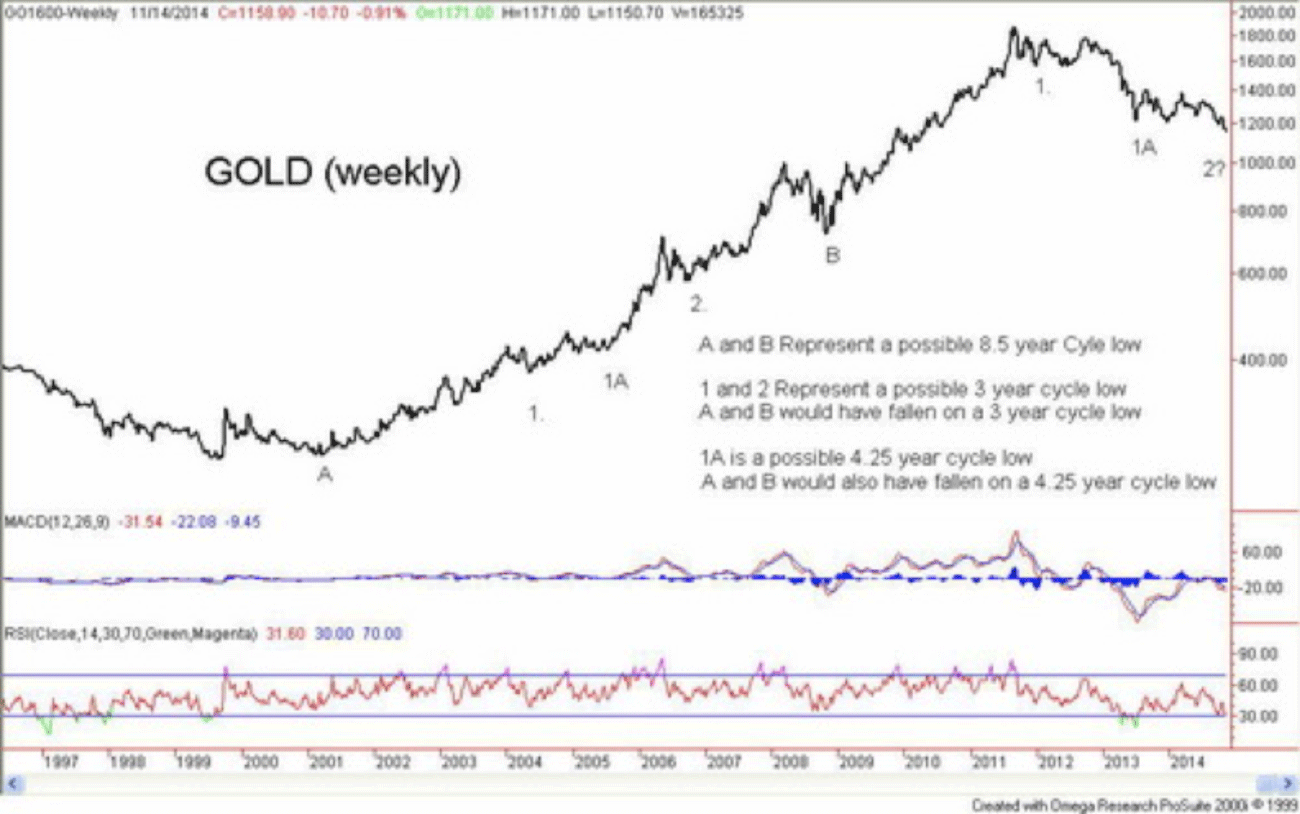
Charts created using Omega TradeStation 2000i. Other possible evidence that a low might be in is that gold may have made, or at least is in the process of making its 3-year cycle low. Ray Merriman of MMA Cycles www.mmacycles.com has stated that gold’s long cycle is one of 25 years. Since gold has not had a long trading history Merriman has used the 1976 as his start point. 25 years later in February 2001 gold made its second and final low near $250. As a result gold is assumed to be in a new 25 year cycle. The 25 year cycle tends to divide into three cycles of 8.5 years. Again from the important August 1976 low key cycle lows can be seen in March 1985, January 1993, February 2001 and October 2008 although the latter was early but still within range. The next 8.5-year cycle low would be due in February 2017 +/- 17 months according to Merriman. The 25-year cycle can also divide into two 12.5-year cycles. If that were correct then the 12.5-year cycle would have been due around October 2013. That fits in well with the lows of June and December 2013. The 8.5-year cycle can subdivide into three 34-month cycles or two 4.25-year cycles. Assuming the 8.5-year cycle did bottom in October 2008 which was also a 3-year cycle low then the December 2011 low fit that cycle well. Measuring from December 2011 the next 34 month cycle low was due October 2014 +/- 6 months. It is possible that the current low is satisfying the 34-month cycle. If the 8.5-year cycle is breaking into two 4.25 year cycles then that would fit better with the June 2013 low. Either way the next important cycle would still be due anywhere from February to September of 2017 +/- 9 months. That is quite a range. Trying to keep a discussion of cycles simple is not easy so treat this as an overview and not a detailed analysis as would be provided by Ray Merriman. If the current 3-year cycle low is in then again the current $1,133 low needs to hold otherwise the final low is not yet in. In order to declare the low in one must see hard evidence. Thus far, that is not forthcoming. While the possible outside day key reversal last Friday is encouraging gold still needs to overhaul $1,180, $1,200 and $1,225 to suggest that a possible low might be in. Down the road, regaining above $1,340 the July 2014 high would be supportive that the low of November 2014 is confirmed. As noted earlier seasonals are turning positive. Also as noted, it wasn’t until December 2013 that the positive seasonals kicked in. In looking back over the years one can see lows followed by good rallies into February/March of the following year that occurred in November 2001, 2002, 2005, 2007, and 2008. The low is not always in November as was seen in 2013. What gold needs now is a trigger. Could war drums spark gold? Things appear to be percolating once again on the geopolitical front as NATO and Ukraine claim Russian military equipment has crossed into Eastern Ukraine. As well, Israel/Palestine appears to be heating up once again. Iraq/Syria/ISIS is ongoing even as Obama has declared that Bashar Assad of Syria must go. Is Obama hinting that they may attack Assad? Who knows but heating up once again on the war front might not only spark a gold rally but set the stock market back once again. Gold has looked into the abyss. The “vomiting camel” was suggesting a large “hurl” was in the process. But last week’s upside key reversal day may be the start of “splat back”. Given the current depressed sentiment for gold that would be a welcome sight. ### Nov 13, 2014 David Chapman: Disclosure Copyright 2014 All rights reserved David Chapman 321gold Ltd |