What's wrong with this picture?
Jack Chan
www.traderscorporation.com
Dec 05, 2005
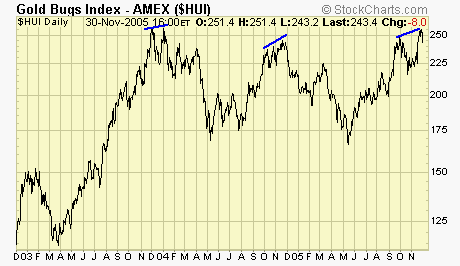
The top chart is the $HUI,
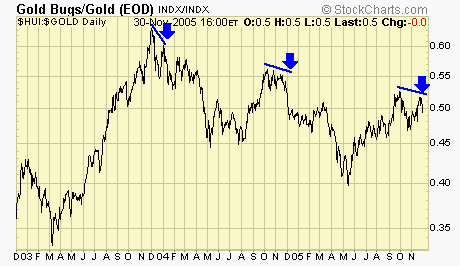
and bottom chart is the performance ratio between $HUI and gold.
For the third winter in a row, stocks failed to assume leadership,
resulting in another bearish divergence. In the past two weeks,
all the ducks were lined up so to speak, to break this bearish
pattern with $HUI challenging the Dec 2003 high of 258.60, but
unfortunately, the $HUI has failed so far.
It is still possible for the bullish scenario, and in order for
that to happen, gold stocks must begin to outperform gold immediately,
otherwise gravity takes over and it will not be pretty.
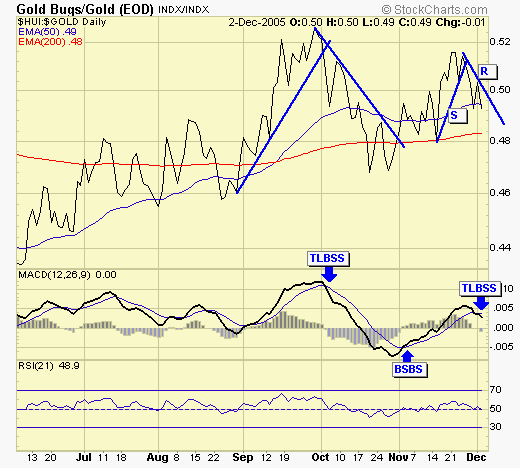
Our leading indicator is once
again a step ahead, already given us a sell signal.
We have taken profits on our trading portfolio and keep stops
tight on our investment portfolio. I refuse to see profits turning
to a loss.
Summary
My analysis on gold and silver
has not changed.
They are rising against all major currencies.
They are rising against other "things".
They are in a roaring bull market.
But we trade gold and silver stocks, and they are not joining
the party, yet.
Keep it simple, follow the market.
End of report
JC
Dec 03, 2005
Jack Chan
 Archives Archives
email: jack@simplyprofits.org
website: www.simplyprofits.org
321gold Inc

|
