A Simple Road Map for Gold
Jack Chan
www.traderscorporation.com
March 14, 2005
Intro
For non subscribers and those new to my commentaries, here is
a recap of what is happening with gold and gold stocks.
- My COT model confirmed a
major bottom on bullion on Feb 8.
- My proprietary BPGOLD has reversed to an up cycle on Feb 22,
confirming the COT model.
- We are now 100% invested in gold ETFs, funds and stocks.
Three simple charts
I've been following this gold bull market since 2001, and apart
from the daily volatility which sometimes could be quite violent,
the overall pattern is near text book perfect.
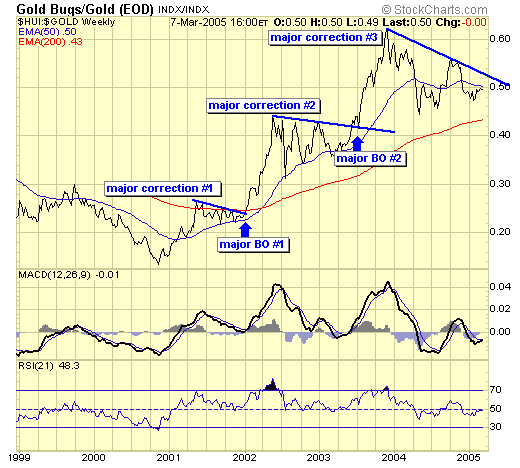
Chart #1 - $HUI:$GOLD
Since bottoming in late 2000, gold stocks as represented in the
$HUI has been rising in a very orderly fashion:
- a six month rise from the
late 2000 bottom followed by a six month correction (#1)
- major breakout (#1) set off another six month rise, followed
by a nine month correction (#2)
- major breakout (#2) set off yet another six month rise, followed
by correction #3 which is still in progress, for fifteen months
now.
A simple observation for those
who did not participate in this new bull market, is that each
rise was stronger and more powerful, therefore, each correction
following each rise has also taken longer to complete before
the next breakout. I use the ratio chart because in order for
the breakout to be legit, gold stocks have to outperform bullion.
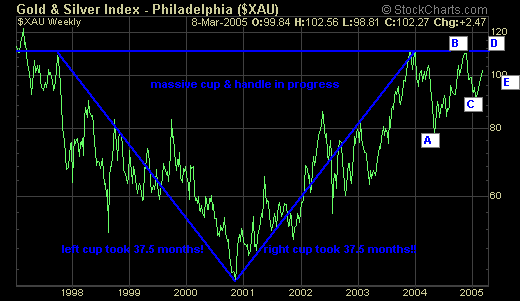
Chart #2 - $XAU
Some of you may have seen this chart before. I first published
it soon after my sell signal in Dec 2003, suggesting a multi
year "cup with handle" was in progress. This chart
is now being circulated in public domaine as different analysts
have used this chart to paint the big picture for the $XAU. But
what really amazes me is the fact that the handle is progressing
text book perfectly, because at the time when I suspected the
cup with handle pattern, it was purely a guess. I mean, take
a look at how symmetrical the pattern is! The left side of the
cup took 37.5 months to complete, and the right side of the cup
took exactly the same time. Now, the handle is mapping out a
contracting triangle with D wave in progress, and if this pattern
continues, one more dip to complete E wave and off to the races
we go.
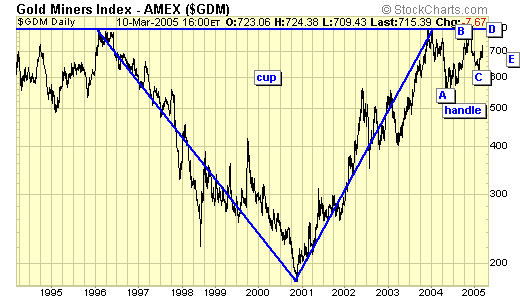
Chart #3 - $GDM
I very seldom see this gold index in public, perhaps not many
people know of its existence. But what a beautiful chart it is.
Similar to the $XAU above, except this chart goes back to 1996,
an eight year "cup with handle". What is interesting
is that the handle is mapping out exactly the same, in a contracting
triangle with D wave in progress.
Summary
Technical analysis is nothing more than an educated guess, and
should not be confused with a trading model. As these illustrations
suggest, we are in a secular gold bull market, and if the analysis
is correct, we have an explosive upside for years to come. However,
as we all know, the major corrections in gold can be devastating
both to your portfolio and mental health as each correction is
more violent and more time consuming, and many traders/investors
who do not have a consistent trading model, could suffer a great
deal both financially and mentally, as the wall of worry continues
to discourage the retail investors. The single most common mistake
many traders/investors make is the urge to know where the market
is going on a short term basis, up or down. To be honest, nobody
knows that for sure, and anyone who claims he/she knows the market
is a fool. The markets are dynamic and subject to constant change,
just because we are clever with lines and patterns and have the
markets neatly in a little box, does not mean the market will
behave accordingly. This is where the trading model comes in.
A good trading model provides the buy and sell signals from a
few simple parameters, with well defined risk and an exit strategy.
Think of it this way: technical analysis is the road map, and
a trading model is the traffic lights. The fanciest GPS may look
good on your dash board, but you must obey the traffic lights
if you want to reach your destination. The next time you are
shopping for a market timer, ask these two questions...
#1 - what is your trading model?
#2 - what do you base your buy and sell signals on?
Good luck.
JC
March 14, 2005
Jack Chan
email: info@traderscorporation.com
website: www.traderscorporation.com
321gold Inc

|