|
|||
|
The Casey Files Doug Casey In view of recent record-breaking gold prices, an understanding of what has been going on in the gold market is important when pondering what might happen next. This article by Bud Conrad, a contributing writer of both the International Speculator and our new Casey Energy Speculator newsletters, provides a quick and graphically intuitive look at the important factors weighing on the price of gold recently. As Bud explains, mine hedging and central bank action are key. Now that the central banks are entering into a new year in their bullion sales agreement, a correction may be next up. Or, with economic fears driven by the winds of yet another hurricane in the Gulf of Mexico, it may not be. With gold's recent 17-year high, the question Bud addresses (What's Holding Gold Back?) is more pertinent than ever. Will gold hold above $450, or will the forces discussed in this article conspire to slap it down once again? If you read my own article on the same subject in the current issue of the International Speculator, you know I believe gold is headed toward $500 by year-end. After that, things will get very interesting. If you are at all interested in gold and gold stocks, and you should be, read on. -Doug Casey [Editors Note: If you're interested in early-stage energy companies with extreme profit potential, take a minute to learn more about Doug Casey's International Speculator and the Casey Energy Speculator. During this charter subscription period, you can save up to 33%. Plus, all subscriptions come with a 100% money-back guarantee meaning you can try it out with no risk!] What's Holding Gold Back?By Bud Conrad Before attempting to answer this question ("What's holding gold back?"), we have to ask: "Is gold being held back?" A starting point in trying to answer this question is to look at how gold is faring compared to oil, the "ultimate" commodity in that it pretty much powers the world. As you can see in the chart below, historically gold has closely tracked the price of oil. You can also see that, even before the recent hurricanes, gold has started to significantly lag oil prices. 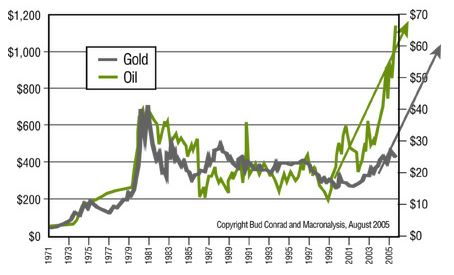 The gray arrow above suggests the trajectory the price of gold "should" take, if it followed its historical pattern with oil. Supporting evidence can be found in the numerous other commodities that have been up more than gold over the past two years. Which brings us back to the core question of "What's holding gold back?" After looking at charts of many different factors that relate to the price of gold, I have come to the conclusion that the two most important drivers of gold are currently hedging by gold mines and the selling off of central bank reserves. For the balance of this article, we'll look at those two drivers. 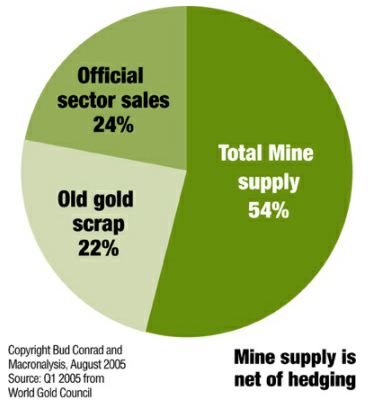 Mine Hedging and Central Bank Leasing In the declining market of the 1990s, mining companies faced a price risk. To manage that risk, they would contract for the delivery of gold in future years at a certain increase in price from the then-current level. The buyers of these futures contracts were mostly bullion banks, the largest being JP Morgan. Such banks are willing to buy gold in the future because they contract with a central bank that will lease gold to them in the present. Why would a central bank lend its reserves to a bullion bank? Because gold doesn't gain any interest merely sitting in the central bank's vault. Such loans allow bullion banks to swap gold they don't yet physically own with gold borrowed from central banks and sell it to end users, resulting in a net short position. The effect of this set of transactions is to add to the supply of gold in the market. Most central banks do not identify their leases as sold, even if the gold has, in fact, been sold on the open market. Lack of transparency makes it difficult to identify the size of bullion bank involvement in these transactions, but one source of data is the Office of the Comptroller of the Currency (OCC), which produces a report on derivatives held by U.S. banks, including gold derivatives. The notional amount of derivatives given by the OCC overstates the amount of money at risk, but it's the best we can do: $63 billion, held by U.S. banks as of Q105. That's about 4,500 tonnes, or almost two years of mine production. JP Morgan alone accounts for $34 billion of the total. A comparison of hedging to the price of gold is informative because the theory is that if there is more hedging, it should depress the price. When gold mines hedge, they enable bullion banks to add future production to the current supply via central bank swaps. Increasing supplies always decrease prices. Conversely, the current de-hedging should be positive for gold. To make that comparison, I have inverted the line showing the size of the derivatives held by U.S. banks and plotted price on the same graph. The relationship faltered in mid-2004, but mine hedging bought by bullion banks does appear to have added downward pressure on the price of gold. 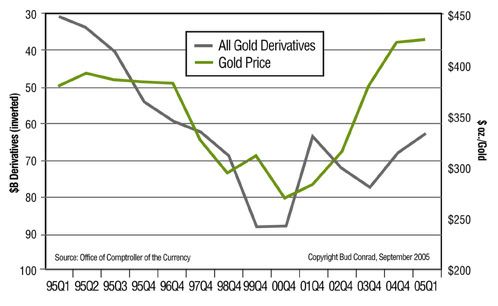 Mine Hedging in Perspective Producers that sold their gold forward, like Barrick, protected themselves from further decreases in the gold price, but abandoned the upside potential of rising gold. Now that gold has risen, shareholders have noticed this and have penalized those gold mines holding a big book of derivative sales. So the mines are now unwinding their hedges, some simply as time passes and their contracts to deliver come due. Others are repurchasing their hedges. As you can see in the chart below, hedging grew until about 2000, but has been dropping since then. When the change in hedge is negative, this is an added demand on the gold supply (shown separately in the green line) and hence a net support to the gold market. More on that in a moment. 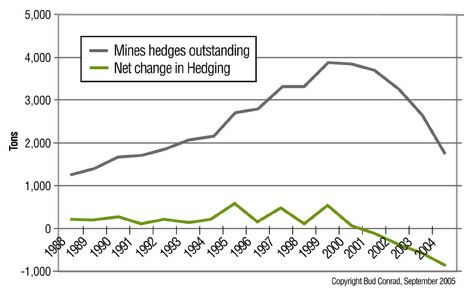 Central Bank Sales Even though no major world currency is backed by gold, central banks still have substantial reserves of gold. These days, central banks seem to be run by people who believe they no longer need to hold gold reserves. Consequently, about 24% of the annual flow of "new" gold comes from central bank sales. In the first quarter of 2005, those sales, annualized, represent an annualized amount of about 1,000 tonnes of gold-an amount that, if sustained, would double the amount central banks have agreed to limit themselves to under their Central Bank Gold Agreement (to only sell up to 500 tonnes per year for the next 5 years). This would be about $14 billion worth of gold. That's not large on a world financial stage, but it's big enough to be a major controlling factor in the relatively small gold market. So, why sell now? While there are a number of theories about these sales, one logical explanation is that central banks that sell gold can book large profits. The accounting of profit comes all at once, because banks don't recognize the increase in price of their gold holdings until they sell (the U.S.' reputed 8,000+ tonnes of gold is accounted for at $42.50 per ounce). Since the ability to book profits looks good, and gives the bank funds for other actions, banks like to sell gold-frequently doing so beyond the 500-tonne limit set by their agreement. These sales naturally act as a depressant to the market. What Is the Combined Effect of De-hedging and Bank Sales? Gold mine hedging was large in the 1990s, but has since slowed, and even unwound, some since 2000. Meanwhile, central banks have continued selling off gold holdings. The chart below identifies the size of these two market forces annually and combines them into one summary measure of tonnes taken from the market or added to it. When the combined black line is above zero, the effect is bullish (gold has been "taken from" the market), and the reverse when below zero. The numbers show that central bank sales are still greater than the hedge unwinding (the black line is still below zero), exerting a negative influence on the price of gold. 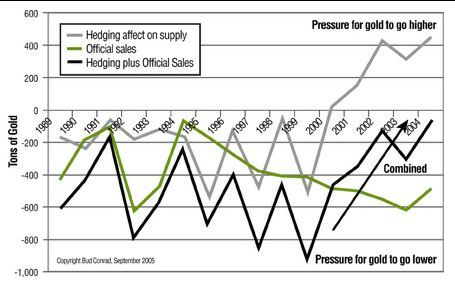 The relative size of these pressures is definitely enough to affect gold prices, as 800 tonnes added to the approximately 2,500 tonnes mined annually is a significant amount for the market to absorb. We can see the result in the price of gold as overlaid on the combined Hedging and Official Sales pressure in the next chart. While these are not the only forces acting on gold, there does seem to be a relationship. 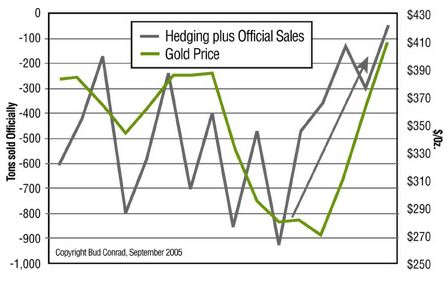 Gold May Not Continue to Be Held Back These specific transactions by market participants directly affect gold's price. The central banks are both selling off their reserves and leasing them out at very low rates. Interpreting their motives is guesswork; I find it equally plausible that they could be looking for short-term accounting gains or trying to manipulate the market. Whatever the truth of that may be, they do not appear to be done selling, though at some point they will have to stop. For now, central banks seem likely to continue selling 500 tonnes per year, as per their agreement. Meanwhile, the mines are only halfway un-hedged, with 1,700 tonnes still to unwind at the end of Q105. If mines continue to un-hedge at the rate of 300 tonnes per year, they would become un-hedged in 5 years, which seems to be a reasonable rate. Subtracting this from the 500 tonnes per year from the central banks would still leave 200 tonnes per year of pressure on the gold market over the next few years. If the central banks were to change course from being sellers to becoming buyers, the change would be dramatic. When might this happen? When the central banks see their own currencies, and the reserve currencies they hold (mostly the U.S. dollar) in a persistent downtrend. We see cracks in the U.S. dollar's purchasing power already. This is measurable in oil and housing prices. Some mines have already switched from being sellers to buyers-central banks could as well. Gold seems poised to rise even more than it has recently, if confidence in paper money is shaken. The Direction for Gold Will Eventually Be Up The real source of gold's rise will be the failure of the world's paper currencies at being stores of value. When currency crises force the central banks to stop their gold sales, we will know that the dollar is in serious trouble and prices of all commodities, including gold, will move much higher. Because gold has been held back, it could well jump more. Bud Conrad [Editors Note: If you're interested in early-stage energy companies with extreme profit potential, take a minute to learn more about Doug Casey's International Speculator and the Casey Energy Speculator. During this charter subscription period, you can save up to 33%. Plus, all subscriptions come with a 100% money-back guarantee meaning you can try it out with no risk!] 321gold Inc |
