| |||
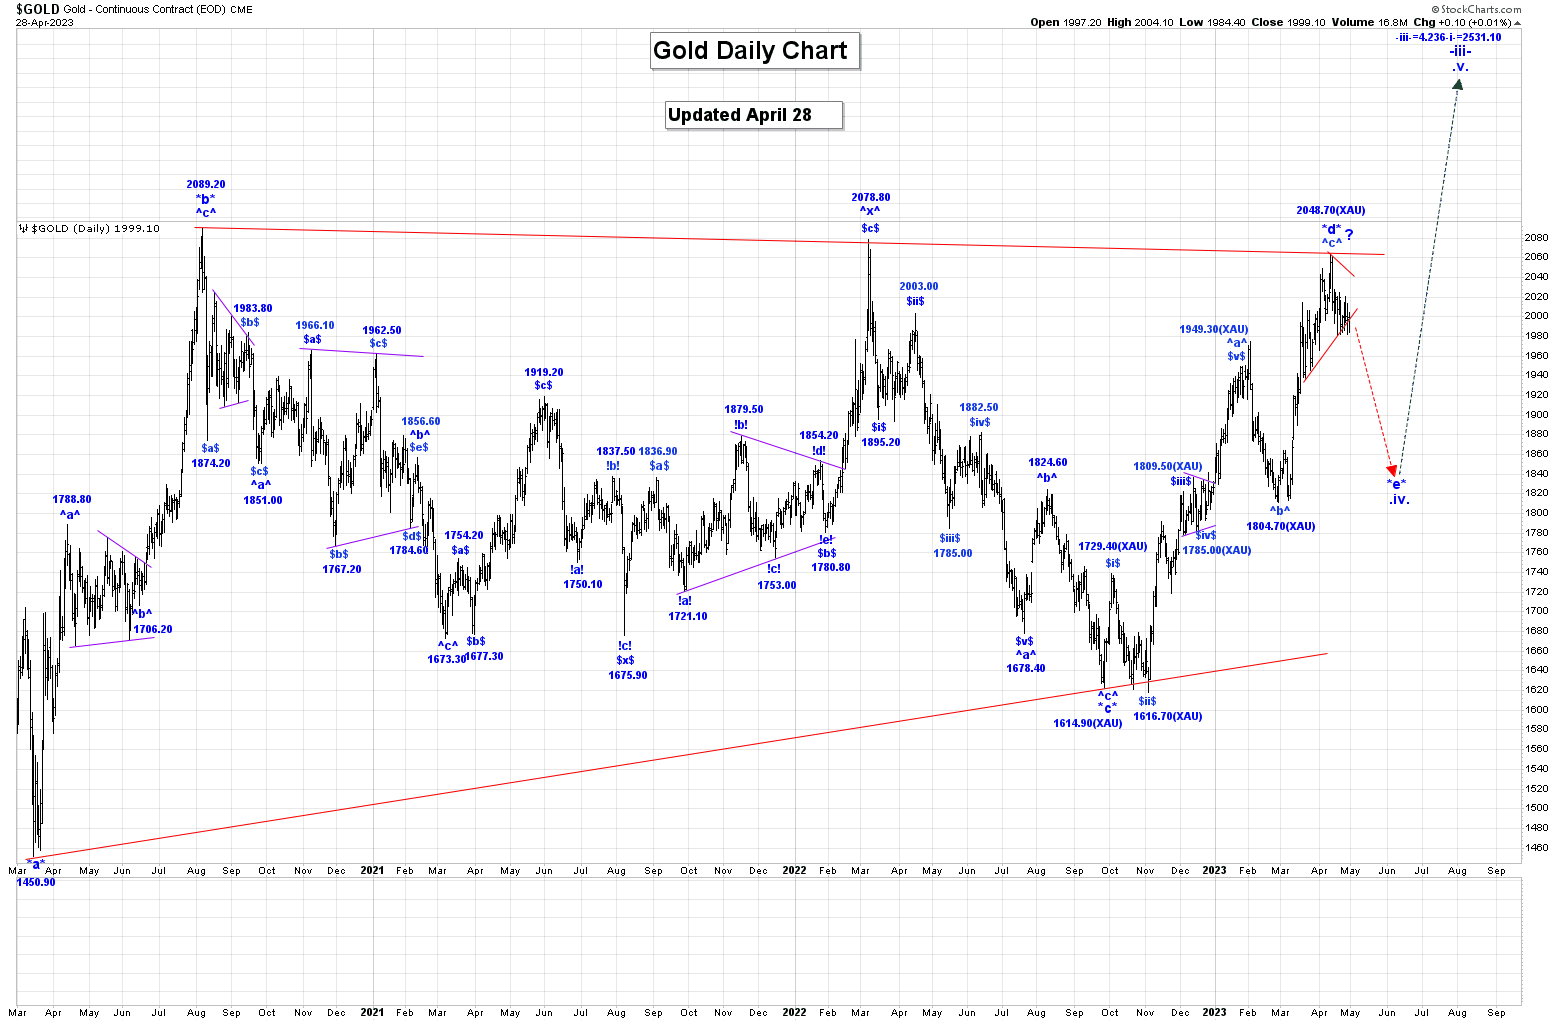
Gold: A Swoon & Then The Moon?captainewave Wave *c* of our very large wave .iv. bullish triangle ended at 1614.90 (XAU). From that low we continue to rally in wave *d*, which appears to be a simple 3 wave pattern, with all of wave ^a^ ending at the 1949.30 high. Wave ^b^ is complete at the 1804.70 low, and we are heading higher in wave ^c^, which may be complete at the 2048.70 high. On the Intraday Chart we are once again watching an expanding and extending bullish triangle formation that started at the 2009.80 high. The current legs of that bullish triangle are: Special Offer For Gold Bugs: Our subscriptions are $289 for 3 months, which is great value. For gold community readers, we have a special offer of $269 for 4 months, good through this week! If you want to do it, please click here or send us an Email and we’ll give you a payment link. Thanks!
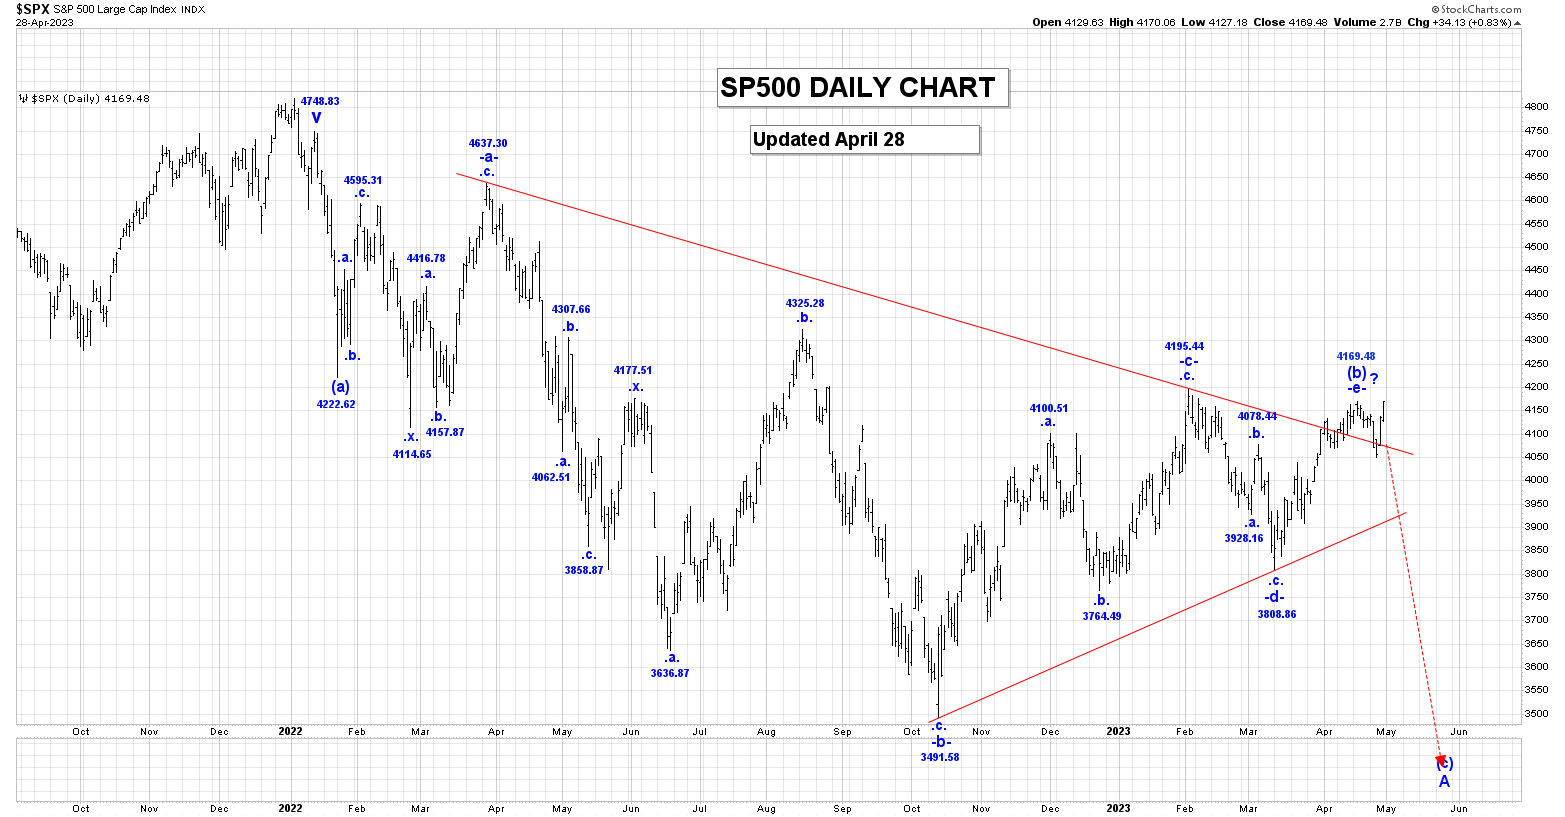
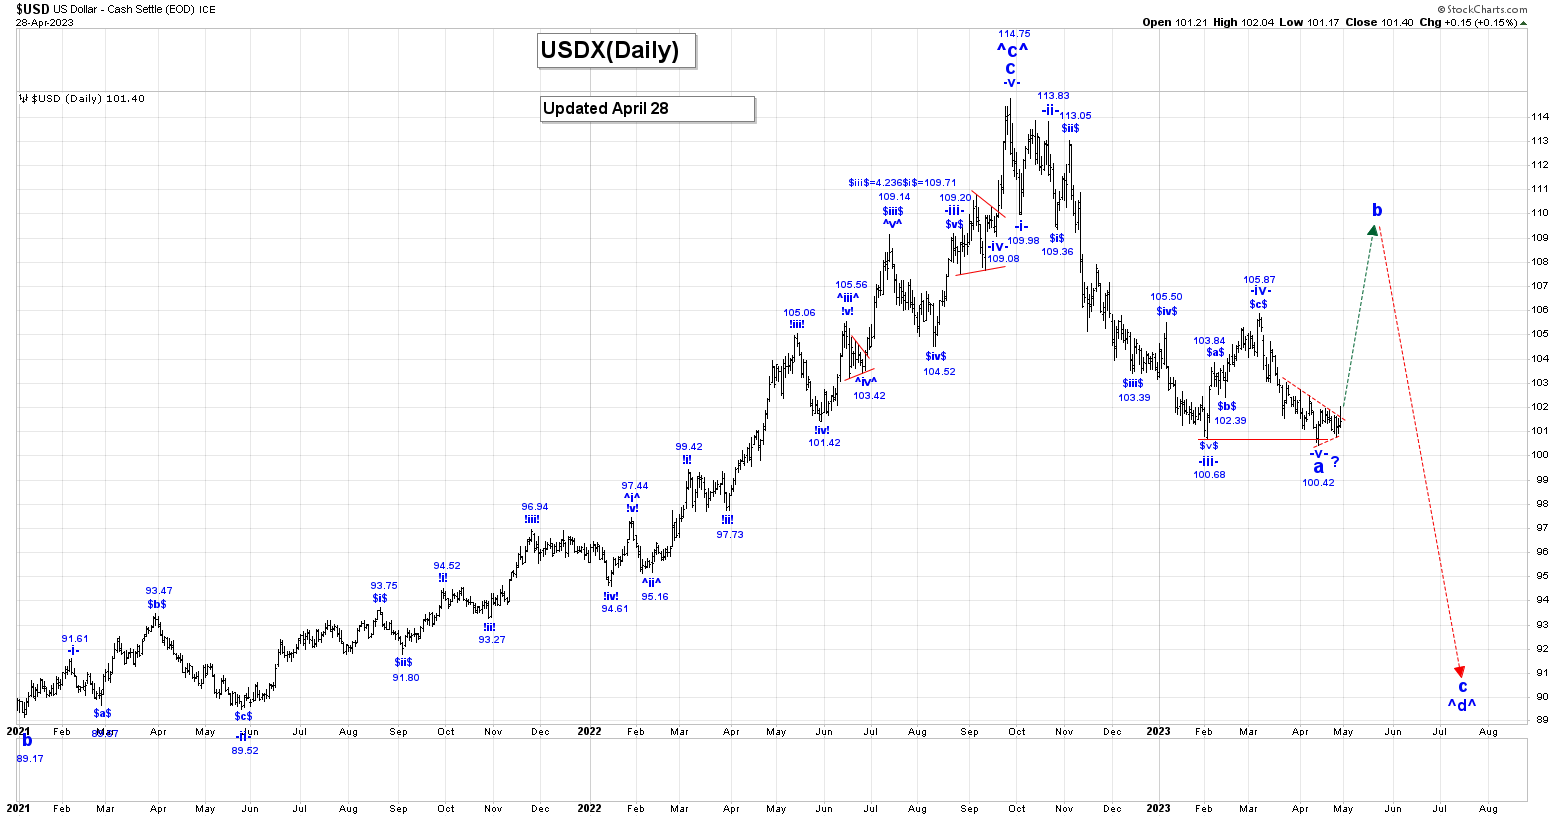
We have now started a multi-decade correction (bear market). Within wave A, we completed wave (a) at 4222.62 and are now working on an almost complete wave (b) bearish triangle. Within that triangle, wave -c- ended at 4195.44 and wave -d- at 3808.86, and we are now rallying in wave -e-, which could be complete at the 4169.48 high. After our large wave (b) bearish triangle ends we expect a very large thrust lower in wave (c) to complete all of wave A. On our Daily USDX Chart we have shown our count for wave a, which may now be complete at the 100.42 low, although we are still waiting for confirmation. ### May 1, 2023 Risk: captainewave.com is an impersonal advisory service and, therefore, no consideration can or is made toward your financial circumstances. All material presented within captainewave.com is not to be regarded as investment advice, but for general informational purposes only. Trading stocks does involve risk, so caution must always be utilized. We cannot guarantee profits or freedom from loss. You assume the entire cost and risk of any trading you choose to undertake. You also agree to bear complete responsibility for your investment research and decisions and acknowledge that captainewave.com has not and will not make any specific recommendations or give advice to you or any of its clients upon which they should rely. captainewave.com suggests that the client/member test all information and trading methodologies provided at our site through paper trading or some other form of testing. captainewave.com, its owners, or its representatives are not registered as securities broker-dealers or investment advisors either with the U.S. securities and exchange commission or with any state securities regulatory authority. We recommend consulting with a registered investment advisor, broker-dealer, and/or financial advisor. If you choose to invest with or without seeking advice from such an advisor or entity, then any consequences resulting from your investments are your sole responsibility. All information posted is believed to come from reliable sources. captainewave.com does not warrant the accuracy, correctness, or completeness of information available from its service and, therefore, will not be liable for any loss incurred. Due to the electronic nature of the internet, the captainewave.com website, its e-mail & distribution services and any other such "alerts" could fail at any given time. captainewave.com will not be responsible for unavailability of use of its website, nor undelivered e-mails, or "alerts" due to internet bandwidth problems, equipment failure, or acts of god. captainewave.com does not warrant that the transmission of e-mails, or any "alert" will be uninterrupted or error-free. captainewave.com will not be liable for the acts or omissions of any third party with regards to captainewave.com delay or non-delivery of the captainewave.com nightly emails or "alerts". Further, we do not receive any form of payment or other compensation for publishing information, news, research or any other material concerning any securities on our site or publish any information on our site that is intended to affect or influence the value of securities. There is no guarantee past performance will be indicative of future results. No assurance can be given that the recommendations of captainewave.com will be profitable or will not be subject to losses. All clients should understand that the results of a particular period will not necessarily be indicative of results in future periods. The results listed at this website are based on hypothetical trades. Plainly speaking, these trades were not actually executed. Hypothetical or simulated performance results have certain inherent limitations. Unlike an actual performance record, simulated trades do not represent actual trading. Also, since the trades have not actually been executed, the results may have over or under compensated for the impact, if any, of certain market factors such as lack of liquidity. You may have done better or worse than the results portrayed. No representation is being made that any account will or is likely to achieve profits or losses similar to those shown. No independent party has audited the hypothetical performance contained at this website, nor has any independent party undertaken to confirm that they reflect the trading method under the assumptions or conditions specified hereafter. While the results presented at this website are based upon certain assumptions believed to reflect actual trading conditions, these assumptions may not include all variables that will affect, or have in the past affected, the execution of trades indicated by captainewave.com. The hypothetical results on this website are based on the assumption that the client buys and sells the positions at the open price of the stock. The simulation assumes purchase and sale prices believed to be attainable. In actual trading, prices received may or may not be the same as the assumed order prices. 321gold Ltd |