| |||
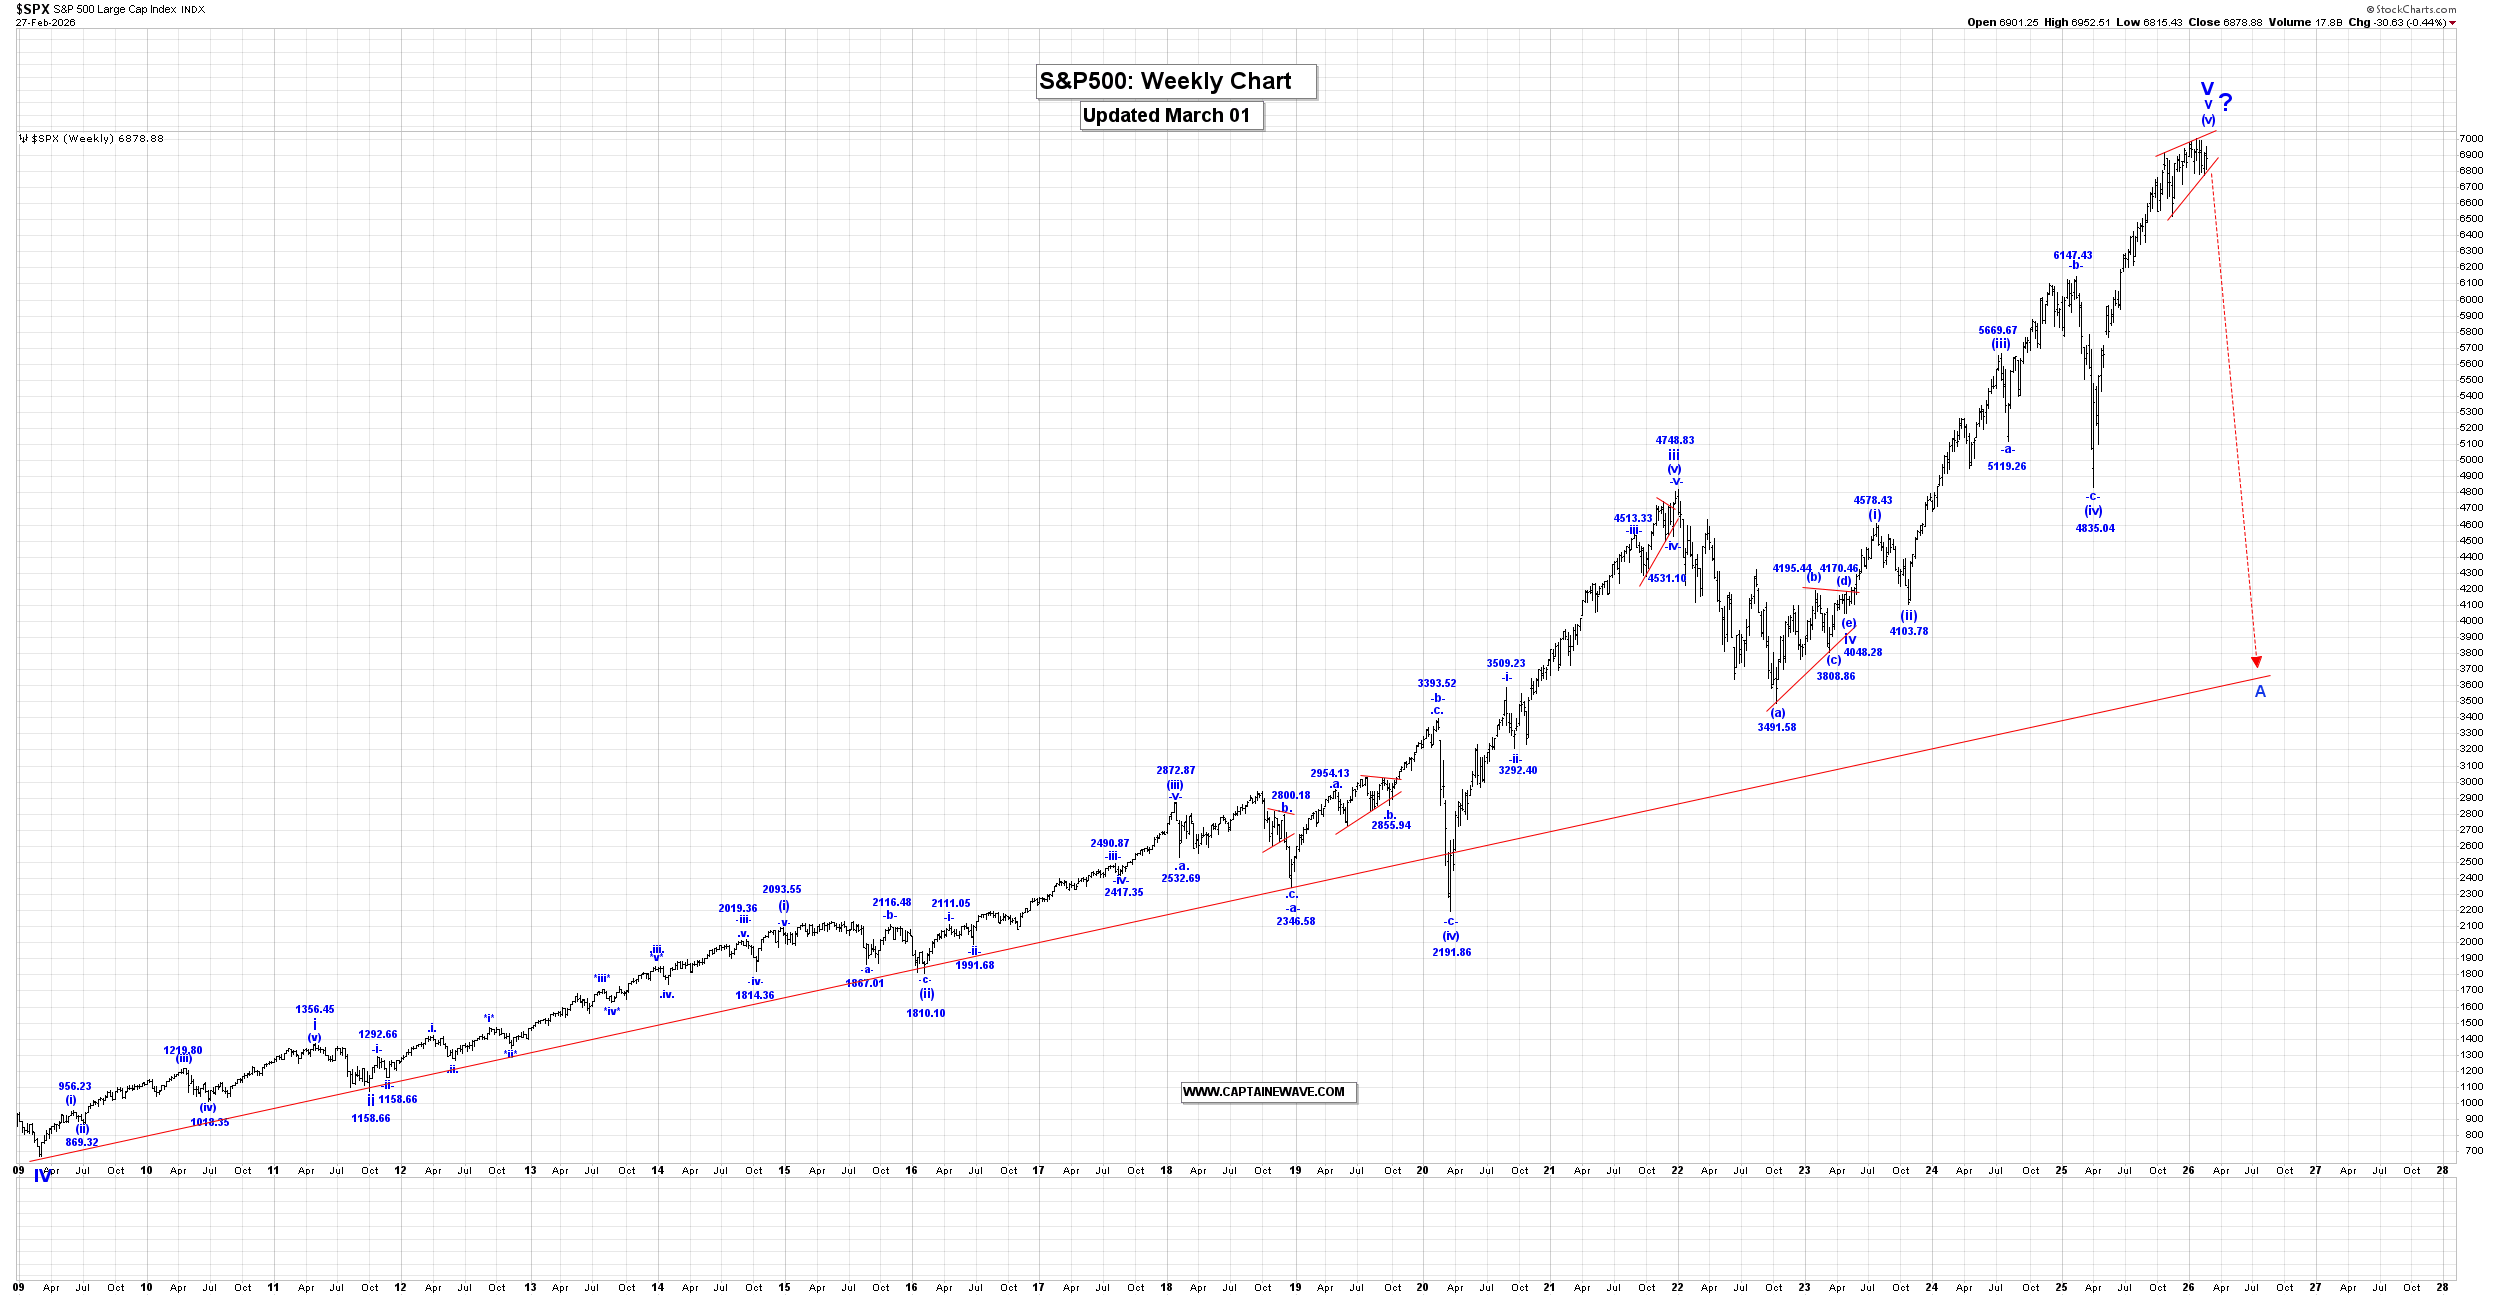
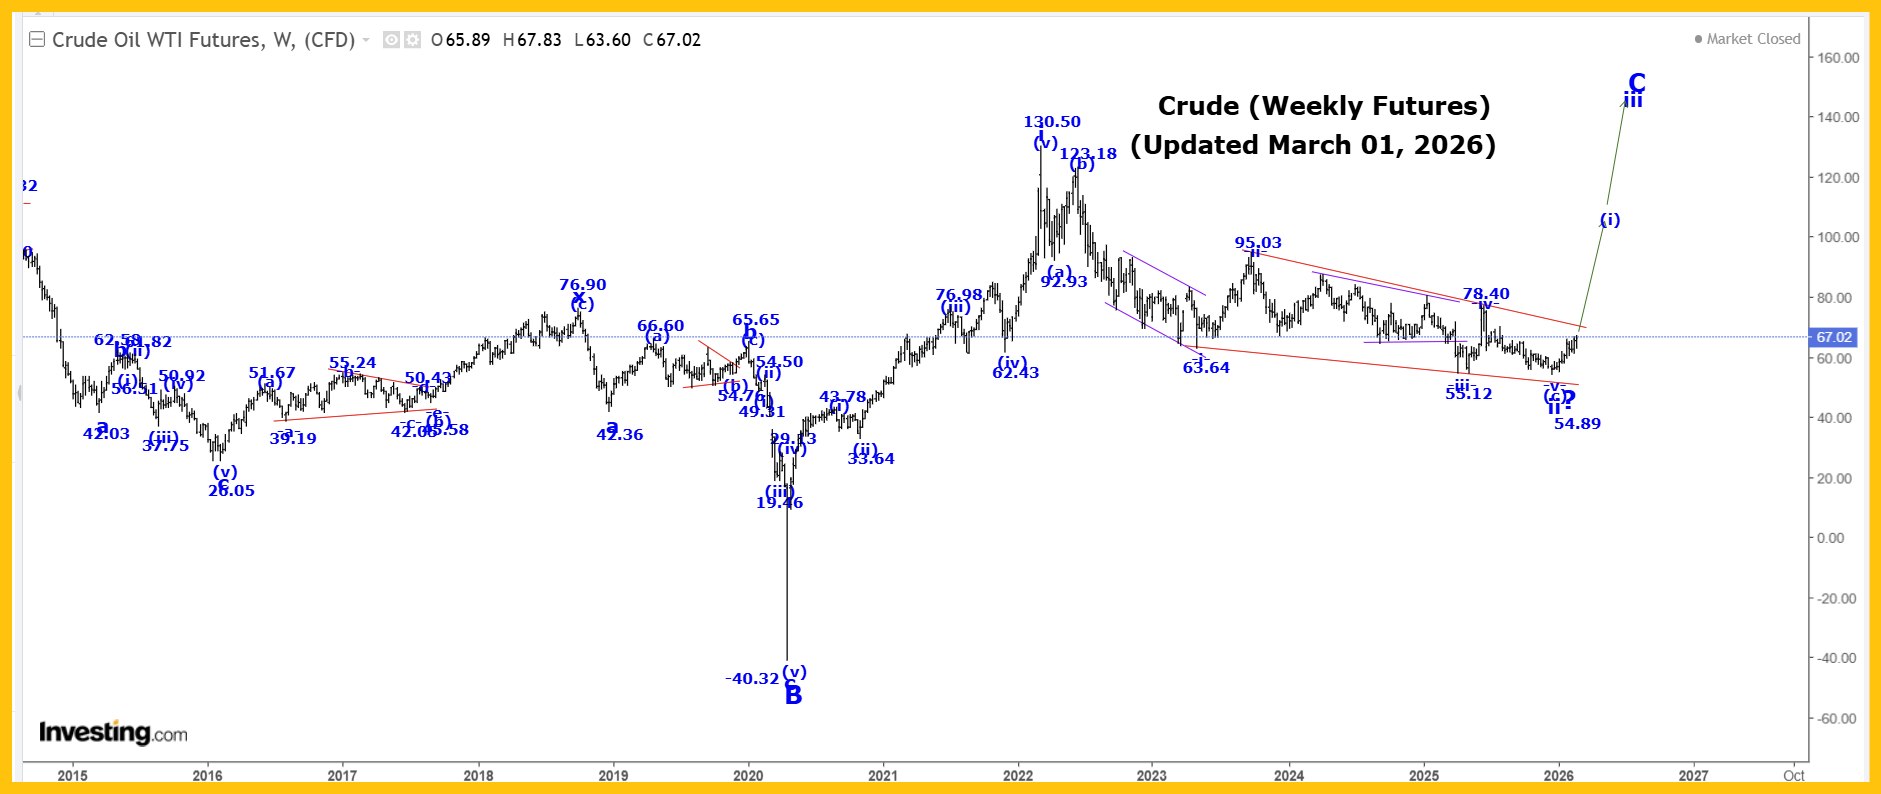
SP500, Oil & Silvercaptainewave Mar 1, 2026 SP500 Please click this link to view the Captain’s weekly SP500 chart. Double-click to enlarge it. The SP500 was initially higher this past week reaching a high of 6952.51, although after that high was made we moved lower, reaching a low of 6815.43 and closing at 6878.88. Analysis: Within v of V, wave (iv) ended at 4835.04 and we are moving higher in wave (v), which has the following updated internal wave count: .i. = 5381.55. We are waiting for confirmation that our wave $v$ of .v. ending diagonal triangle formation is complete at the 6952.51 high, as a failure high, as opposed to expanding and extending further before it ends. A drop now below the 6775.50 low would suggest to us that this ending diagonal triangle is complete at the 6952.51 high and that we are heading sharply lower! Active Positions: Flat the futures and long the SPXS leveraged bear ETF! Special Subscription Offer: At $99/mth the Captain Ewave newsletter value is superb, and we have a special offer this week of just $199 for a three-month subscription. Investors get six updates a week from the Captain AND his key signals for the market… when he issues and acts on them himself. Send us an email at admin@captainewave.com or click this link and we’ll get you on board! Thank-you! Crude Oil Please click this link to view the Captain’s weekly oil chart. Double-click to enlarge it. Crude was higher again this past week, reaching a high of 67.83 and closing at 67.08. Analysis: Our internal wave count for wave ii to looks like: (a) = 92.93. We have completed the minimum requirement for an end of our wave -v- ending diagonal triangle formation, at the 54.89 low, although only a break of the upper red trendline connecting 95.03 and 78.40 will confirm this to be the case. After wave ii ends, we expect a very sharp rally higher in wave iii, and we will provide our projected endpoint for its completion after wave ii ends. In the long term we are now rallying in wave C that has the following projections: C = A = 153.77!
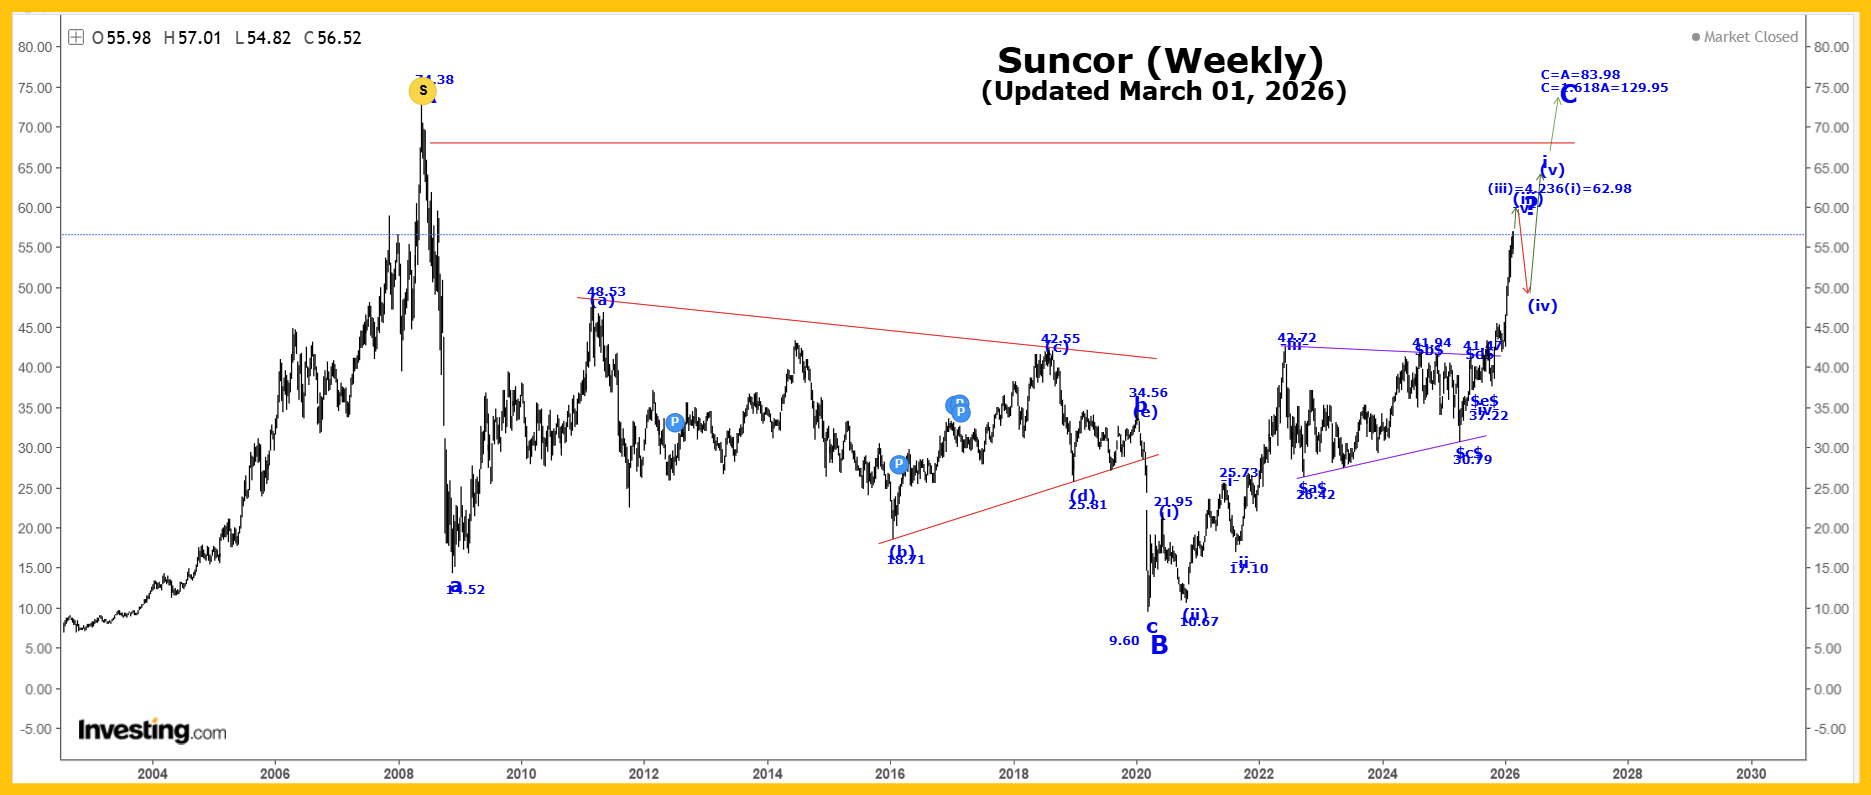
Please click this link to view the Captain’s weekly Suncor chart. Double-click to enlarge it. Active Positions: Long oil futures, with put options as our stops. Long Suncor too!
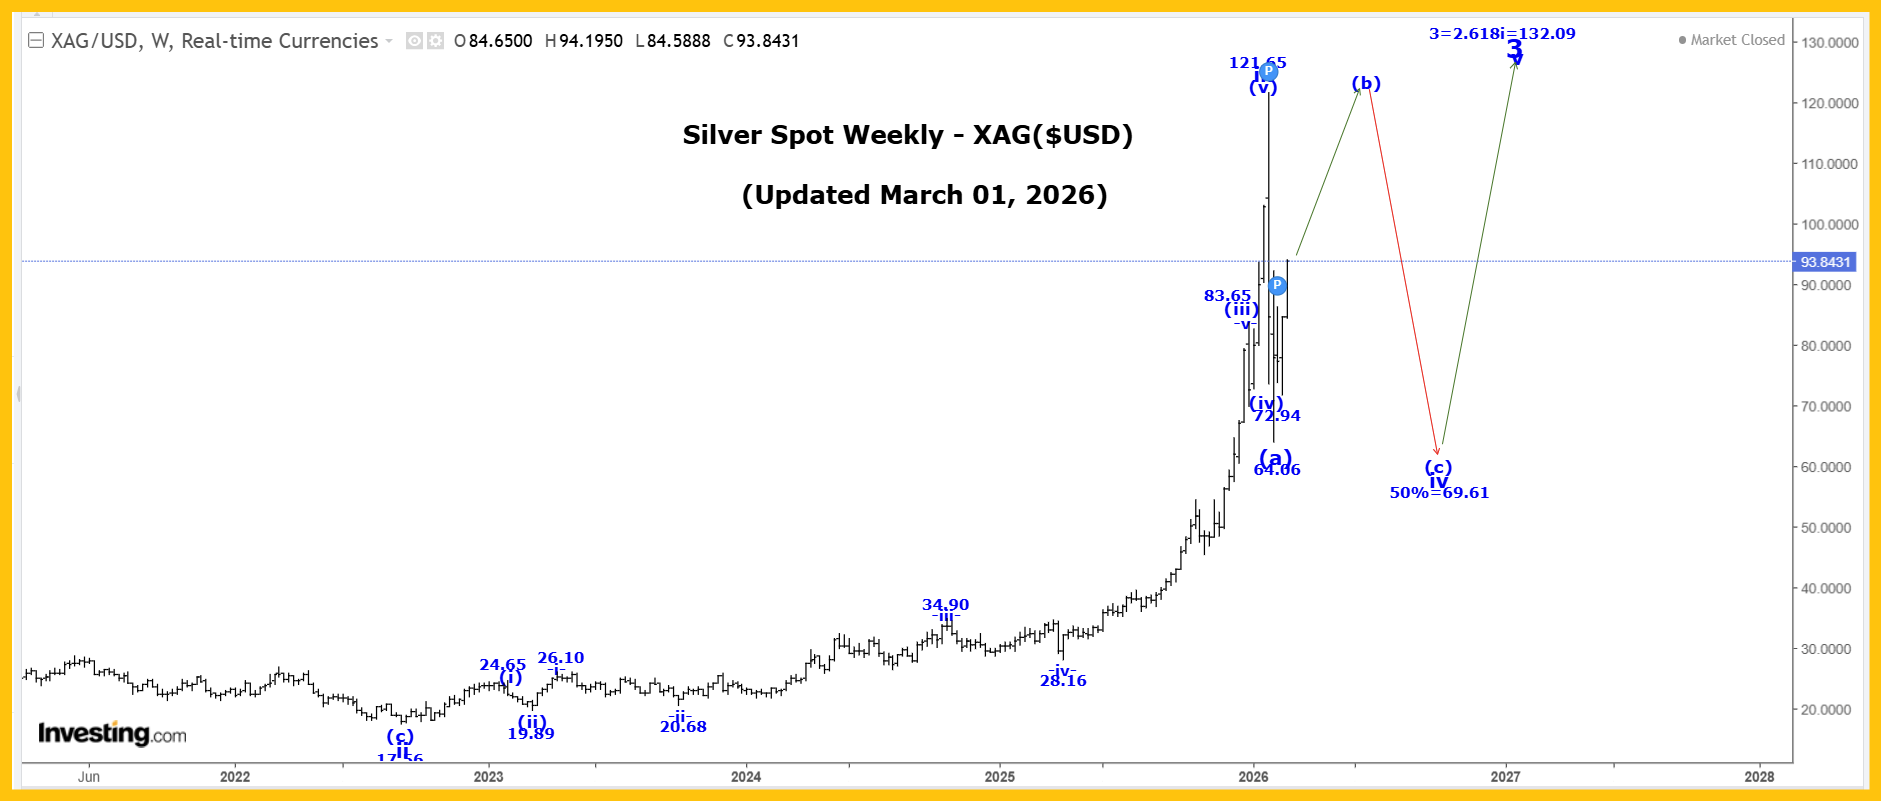
Please click this link to view the Captain’s weekly silver chart. Double-click to enlarge it. Silver was sharply higher this past week, reaching a high of 94.20 and closing at 93.84. Analysis: A very powerful wave iii ended at the 121.65 high, and we are falling in a multi-month wave iv correction that has the following retracement level: 50% = 69.61. We have reached our 50% retracement level, but we still doubt that all of wave iv is complete at the 64.06 low and instead we likely just completed a three-wave structure wave (a) of iv at that low. If that is the case, then we should now be moving higher in wave (b). Since the wave (a) drop was a three-wave structure we should assume that wave iv is going to become a flat, irregular or even a bullish triangle corrective pattern. In all of these cases, wave (b) is likely heading back to 121.65 high, or very near it and may even exceed it before it ends! After wave (b) ends we expect a wave (c) drop, that should return to at least the wave (a) low of 64.06, except in the case of a bullish triangle where we will not revisit that low before wave iv ends. We expect very high volatility to continue as wave iv develops. In the long term, we completed all of wave III at 49.00 in 1980 and all of wave IV at 3.55 in 1993. We are now working on wave V and within that wave we have the following count: 1 = 49.56. Active Positions: Long, through PSLV:TSX! Free Offer For 321Gold Readers: Please send me an Email to admin@captainewave.com and I’ll send you our free “CDNX: It’s Rally Time!” report. We highlight the incredibly bullish wave counts for the CDNX and recommend some hot junior miners too. We include both weekly and daily charts… with price targets! Thank-you! Risk: captainewave.com is an impersonal advisory service and, therefore, no consideration can or is made toward your financial circumstances. All material presented within captainewave.com is not to be regarded as investment advice, but for general informational purposes only. Trading stocks does involve risk, so caution must always be utilized. We cannot guarantee profits or freedom from loss. You assume the entire cost and risk of any trading you choose to undertake. You also agree to bear complete responsibility for your investment research and decisions and acknowledge that captainewave.com has not and will not make any specific recommendations or give advice to you or any of its clients upon which they should rely. captainewave.com suggests that the client/member test all information and trading methodologies provided at our site through paper trading or some other form of testing. captainewave.com, its owners, or its representatives are not registered as securities broker-dealers or investment advisors either with the U.S. securities and exchange commission or with any state securities regulatory authority. We recommend consulting with a registered investment advisor, broker-dealer, and/or financial advisor. If you choose to invest with or without seeking advice from such an advisor or entity, then any consequences resulting from your investments are your sole responsibility. All information posted is believed to come from reliable sources. captainewave.com does not warrant the accuracy, correctness, or completeness of information available from its service and, therefore, will not be liable for any loss incurred. Due to the electronic nature of the internet, the captainewave.com website, its e-mail & distribution services and any other such "alerts" could fail at any given time. captainewave.com will not be responsible for unavailability of use of its website, nor undelivered e-mails, or "alerts" due to internet bandwidth problems, equipment failure, or acts of god. captainewave.com does not warrant that the transmission of e-mails, or any "alert" will be uninterrupted or error-free. captainewave.com will not be liable for the acts or omissions of any third party with regards to captainewave.com delay or non-delivery of the captainewave.com nightly emails or "alerts". Further, we do not receive any form of payment or other compensation for publishing information, news, research or any other material concerning any securities on our site or publish any information on our site that is intended to affect or influence the value of securities. There is no guarantee past performance will be indicative of future results. No assurance can be given that the recommendations of captainewave.com will be profitable or will not be subject to losses. All clients should understand that the results of a particular period will not necessarily be indicative of results in future periods. The results listed at this website are based on hypothetical trades. Plainly speaking, these trades were not actually executed. Hypothetical or simulated performance results have certain inherent limitations. Unlike an actual performance record, simulated trades do not represent actual trading. Also, since the trades have not actually been executed, the results may have over or under compensated for the impact, if any, of certain market factors such as lack of liquidity. You may have done better or worse than the results portrayed. No representation is being made that any account will or is likely to achieve profits or losses similar to those shown. No independent party has audited the hypothetical performance contained at this website, nor has any independent party undertaken to confirm that they reflect the trading method under the assumptions or conditions specified hereafter. While the results presented at this website are based upon certain assumptions believed to reflect actual trading conditions, these assumptions may not include all variables that will affect, or have in the past affected, the execution of trades indicated by captainewave.com. The hypothetical results on this website are based on the assumption that the client buys and sells the positions at the open price of the stock. The simulation assumes purchase and sale prices believed to be attainable. In actual trading, prices received may or may not be the same as the assumed order prices. 321gold Ltd |
