|
|||
HUI vs. Gold: Good-Buy from "Weak Hands"Stephan Bogner
Today I read an excellent article titled "The Dip," in which the author demonstrates a "new" chart pattern that seems to be typical for the HUI goldmining share index. (1) The author drew the following chart:
Here is an excerpt of this
article; please read the full version at the following great
website:
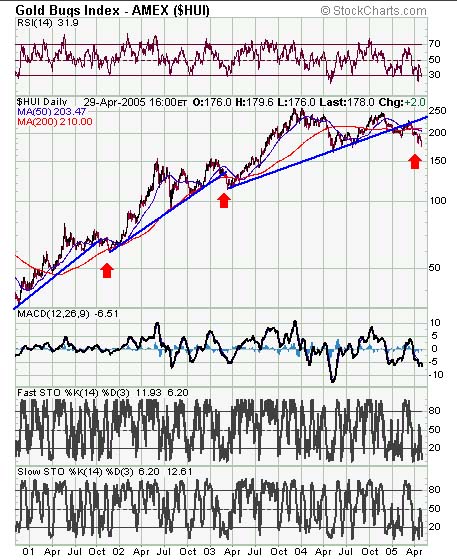
That's what I did: I was looking for "capitulation" signs in the HUI relative to the gold price. These are moments when the relative HUI shortly crashes below support. The following chart shows - at a first glance - that while the red supporting trendlines were holding strongly, there were some "overreactions" which we henceforth call "collapses:"
The red triangles are defined as follows:
What we are witnessing now (the sharp pullback to the apex of the current red triangle) must be a lustration ("correction") of the prior collapses. This is consistent with the theory that all price movements, no matter if "small overreaction" or not, will have a future impact on the price. Since there were quite a number of "overreactions" in the past, the current sharp pullback to the intersection of all the blue support lines is of vital importance as this lustration is washing out all prior excesses ("overreactions"). To be able to fully "clean" the market, the ongoing pullback needs to give the sign to the market that the ongoing "crash" is of unparalleled example and "deeper" than all the lustrations before. The result is that "weak lungs" will drown and therefore not be able to influence the market in its own next "resurrection." "It's
the death that makes life possible" The only "problem" is that the prior excesses could be too big to wash out, as the nature of a triangular formation is that once having reached the apex, the price can either explode to the upside or crash: "The
path to the height is the same that leads into the depth." It is important (for the mid-term trend) that the current support holds. A small and short "overreaction" to the downside shall be forgiven and will make us (better: the potential backlash to the upside) even stronger.
In regard to the above chart, the HUI relative to the price of gold is near or at its "perfect" bottom at the moment. If this support holds, then the 4th boom since the new millennium will begin, which shall be outshining the previous ones by large as the current 9-month "final movement" (breakout and pullback to the apex beginning in the 9th month of 2003) must have washed-out the last "weak hands" and finally have cleaned the market of prior excess driven spectators/speculators. "9 is the last figure. It symbolizes outcome. In 9, you harvest what you have sewn previously. It's positive aspects are idealism, humanism, with openness on the world (tolerance, new way of life or of thinking) but it can also have moments of inner tension, jolts, breaks, the price to pay after all the previous bad actions. The 9th month of pregnancy will end gestation and announce the birth of a child." (2). Generally, there is "a lot" to catch up to. A rise of the HUI relative to the gold price from its current level of 0.40 to more than 0.60 is probable as the next boom would have to mark a new "black-dotted-zone" which in regard to the logarithmic chart might be the "psychological" 1,0 hurdle. If this resistance will be touched in the next move up, then the HUI is outperforming the gold price by 150%. In the beginning of 2002, the HUI rose from approx. 0.25 to 0.45 relative to the gold price. An outperformance of 80%. The HUI itself rose from 60 to 150 points - A rise of 150% in only 2 months. In the middle of 2003, the HUI rose from approx. 0.40 to 0.65 relative to the gold price. An outperformance of 63%. The HUI itself rose from 110 to 250 points - A rise of 127% in only 2 months. Correlation Test: If 80% equals 150%, then as per "the
rule of three" must a rise of 63% generate 118%. De facto
the HUI rose by 127%. 7% difference. Neglectable?
References: (1) Article: "The Dip,"
Saturday, 30th April 2005, Source: (2) Read more about numerology at: 3 May, 2005 321gold Inc |