The Wind of Change
Gold versus Dollar
Stephan Bogner
www.silberinfo.de
13 April, 2005
"The wind of change
blows straight into the face of time like a stormwind that will
ring the freedom bell." (1)
To evaluate the short- and
medium-term movements of the price of gold (POG) more efficiently,
the super ordinate trend pattern, which can only be found on
long-term charts, might help.
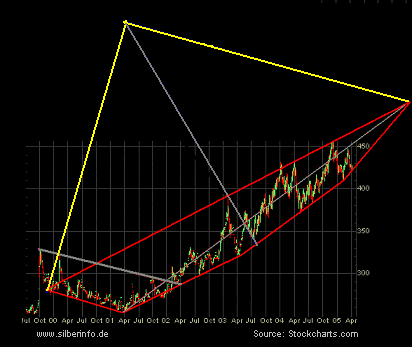
After the POG rose 23-fold
in the 1970s, a 20 year sideways consolidation period
began. This movement took the shape of a triangle. Chart-technically,
a triangle is either a continuation or correction formation.
If a price fluctuates between the boundaries of increasingly
tighter sloping trend lines, the compression between "bulls
and bears" is as well increasing. The consequence is that
the price either explodes or crashes near the apex of the triangle
("Thrust").
"The
path to the height is the same that leads into the depth."
Heraklit
von Ephesos
Another, but in regards to
the "mysterious" gold market even more interesting,
typical characteristic of a triangular price formation is that
because of the relatively low trading volume at the end of the
triangle only marginal funds and/or market influencing news are
required to steer the price towards a certain direction.
In the middle of the 1990s
the upper leg of the above triangle was broken ("breakout").
The price level which was marked by the breakout is a decisive
and final resistance in the future (in case of a final correction
to the apex). When this resistance will be passed during a thrust,
the final upswing to the minimum price goal will take place:
To the highest price marked by the triangle. For the POG: $752.
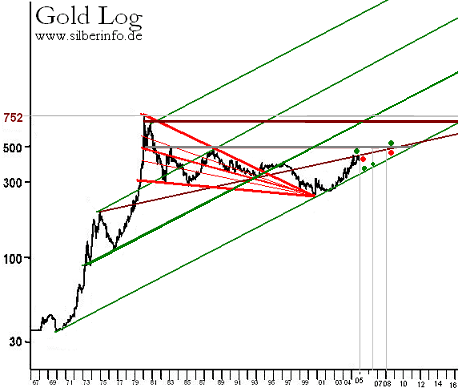
After a breakout occurred,
the price can start rising sustainable immediately. Oftentimes
the price corrects a last time to test and mark the former resistance
leg as new support. Such a "pullback" might have the
result of having pushed out "the last weak hands" what
must be supportive for the new trend.
During a pullback the price
often moves exactly to the apex of a triangle from which point
the price acceleration starts either to the up- or downside.
Regarding the gold market it was the announcement of the "Washington
Agreement on Gold" (central banks collectively limit their
gold sales) which ignited the thrust to the upside. Perfect timing
or coincidence? Be that as it may, the POG is in an uptrend since
then. To make this new trend sustainable and being able to rise
to the minimum price goal, the POG needs to take the resistance,
which was marked by the previous breakout, as support. The POG
is trying to do that at the very moment. The question now is
if the POG succeeds directly or if there will be a "small"
correction to the lower green support line whereupon a breather
the price will attack again.
The micro-macro-thesis claims
here that medium-term and even intraday price movements preferably
take the same formation pattern that dominates the superordinate
picture.
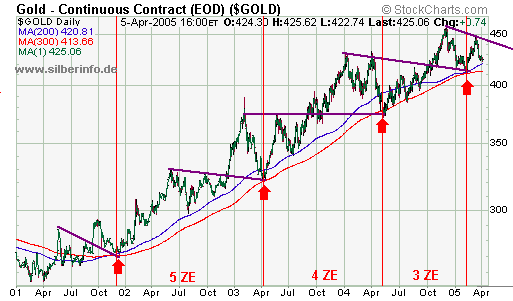
If we put the thrust since
2001 under the magnifier one can see 5 resistance legs (violet)
at which the POG was consolidating for quite some time. Every
time when the price was breaking such a resistance (breakout)
it was correcting back to this new support (pullback) whereupon
the price rose sustainable. During the pullback the price fell
exactly to the intersection of the violet leg and the 300 days
moving average curve ("MA"). During the last pullback
the 300 MA touched the 200 MA curve for the second time. As long
as the 300 MA slopes above the 200 MA curve, the medium-term
uptrend is still intact. (ZE stands for time unit)
Within the volatile price movements
since the end of 2003 a triangular pattern can also be found
as follows:
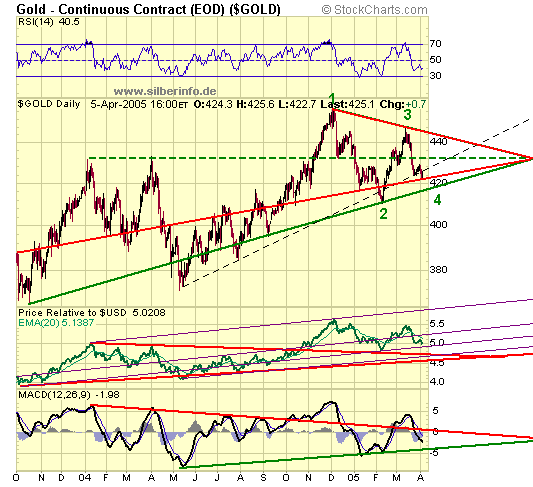
- Ideally there are 4 waves
within the boundaries of a triangle before the impulse movement
(wave 5) starts. This final wave forces the price to break one
of the legs to be able to break out and rise sustainable.
- If the POG is not moving to
the lower green leg and finds lasting support at the red one,
the price will have moved within the perfect symmetrical (red)
triangle (same angle of the legs to the green-dashed line in
the middle). In this case, the price retracement at the green
"2" was only a neglectable overreaction.
- But not only because of the
RSI- and MACD-Indicator, which both still have room to the downside,
one shall take a correction to the lower green leg into account
and not overreact during such an event.
Because during a triangular
price formation it is not possible to predict in which direction
the price will finally thrust and because the POG still has potential
to the lower leg at $418 at the moment, it might help to have
a closer look at the Dollar as the Greenback apparently seems
to influence the POG in a dominant fashion.
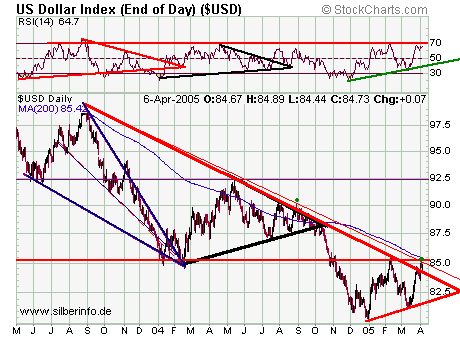
- The strong losses of the Dollar
at the end of last year was the result of a to the downside thrusting
triangle.
- The Dollar fell below the
previous strong support at 85 index points.
- The Dollar pulled back to
this new resistance at 83.35 points which wanted to get marked
as such for the future.
- Thereafter the Dollar fell
but with a higher low and the 85 points were touched a few hours
ago.
- The RSI-Indicator already
shows an overbought and therefore overheated market.
- The Dollar might further rise
to its 200 MA curve, from which resistance it might fall the
downside.
Because the Euro has not yet
established any self-derived dynamics (momentum) and virtually
correlates perfectly negative with the Dollar, the picture of
the Euro looks almost laterally reversed:
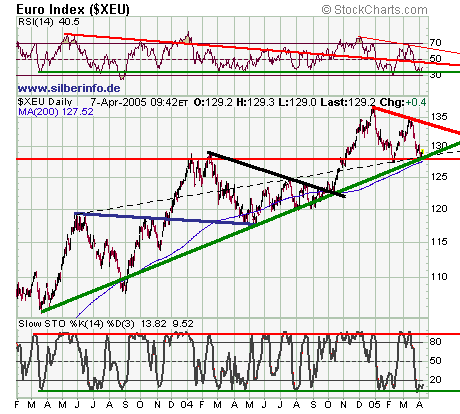
- The Euro recently fell to
strong support.
- The RSI is in the oversold
area.
- High probability that the
stochastic along with price will start trending to the upside
soon.
To assess better how the Euro,
Dollar and POG might behave, one takes a more long-term picture
into the hand.
The entire development of the
Dollar since the new millennium was fluctuating in the protective
boundaries of a triangular price formation which basically is
nothing else than a "sideways consolidation". A "real"
crash therefore is yet to come.
The "core" triangle
is the blue one at which after 4 waves the impulse movement noticeably
started as the lower leg was breached. But a sustainable crash
did not occur. The Dollar always managed to get back into the
triangle until wave 8 broke the upper leg. This breakout along
with the violations of the lower (blue) legs generated the superordinate
red triangle which now after 4 waves started the impulse movement
that a few hours ago broke the upper leg. The Dollar can explode
or crash any time now. It's also possible that in the meantime
a final pullback to the direction of the apex will occur. The
violet triangle shows an area in which a possible breakout might
go to. A fall back into the triangle can occur any time as well
- as within the boundaries is yet enough potential (in form of
volatility) to let the Dollar thrust to the up- or downside.
A definite sell signal can only be generated when the lower leg
is being breached. Slowly the first are listening to speculative
signals which can push the Dollar to a breakout to the upside.
The general sentiment for the Greenback in the broad gold and
dollar analyst-camps are rather bullish. Will the "last
weak hands" being now pushed out of the market with a breakout
to the upside before a sharp pullback to the apex and a potential
further crash?
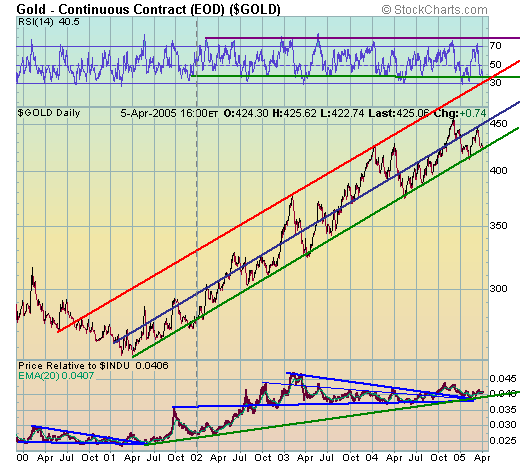
The POG as well is moving in
between triangular boundaries since the beginning of its new
trend.
- After 4 waves the impulse
movement broke the upper leg and was able to hold on it for some
short time but the price fell back into the triangle from where
new attacks were launched.
- At the end of 2004 the upper
leg was broken again. This breakout as well was marking important
future resistance: the red trendline. As soon as this resistance
has been transformed into support, a "strong" move
up shall occur.
- In contrast to the Dollar,
the apex is very near. This means that the POG must decide shortly
in which direction the new trend will start.
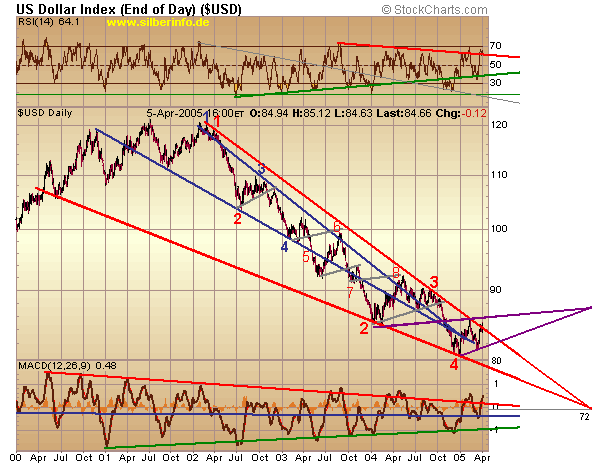
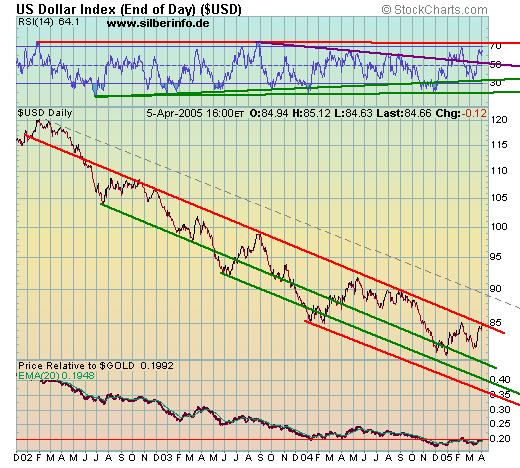
Because the Dollar is ostensibly
influencing the POG in a dominant fashion since the beginning
of its downtrend, it might help to take a long-term chart of
the Greenback into consideration to be able to judge better in
which direction the Dollar and therefore Gold might tend to in
the medium-term.
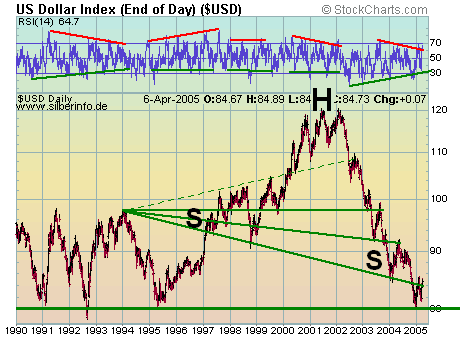
- After a "strong"
3 years correction the Dollar is now located at strong support
which originates from the 1990s.
- The Dollar has been moving
within a massive Head and Shoulder Formation (HSF).
- The consequence of a HSF is
that the price crashes below the neckline. Oftentimes after a
first retracement below the neckline there comes a pullback to
the neckline whereupon the price will fall sustainable.
- The possible necklines were
successively broken as per the rules of HSF (firstly a small
crash below the neckline, then pullback, then strong crash)
- At the moment the Dollar is
at its "last" neckline at 80 points which is a horizontal
one.
- From this point many analysts
are predicting a long sideways movement ("recovery"
or extensive right shoulder)
- Not until this support has
been breached the Dollar will fall sharply.
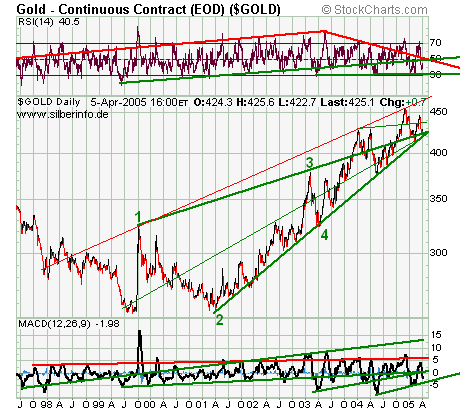
The (market) value of the Dollar
calculated in terms of Gold is as well moving within a HSF. The
difference is that the final trend is already in sight.
Dollar relative
to the POG:
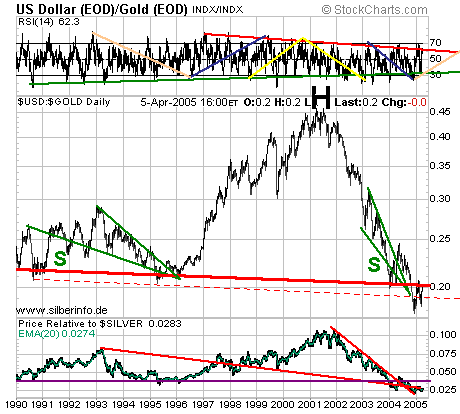
- The lower neckline is already
breached!
- A first breakdown occurred
along with a subsequent pullback to the neckline.
- A sustainable crash to the
downside can occur any time from now. This would mean that the
ongoing trend since 2002 (one needs fewer and fewer ounces of
Gold to buy one paper Dollar) will not only continue but accelerate.
As generally known, the POG
is numeralized in U.S. Dollars whereas the opinion apparently
dominates at the moment that if the Dollar gets "cheaper"
the POG "automatically" gets "more expensive"
by the same amount but i.e. towards the Euro stays the same.
This peculiarity of the POG makes some analysts feel uncomprehending
when colleagues philosophy in a pessimistic manner about the
collapse of the financial system and provoke the beginning of
"the Ultimate Gold Boom". The Dollar has lost more
than 30% of its value in more than 3 years and is located at
the strong support level of the 1990s. Despite the many sound
arguments for a further depreciating Dollar it might recover
for some time now after the strong losses and consolidate sideways
before a next move down must occur. The reverse conclusion is
that the POG will be doing exactly the opposite: firstly it will
fall further and consolidate volatile sideways. This conclusion
is correct but - deliberately or not - one important sentence
is set aside: The POG can rise hand in hand with a strong Dollar.
The POG is not only influenced by the Dollar but by many factors
and a dominance of the Dollar can not be lasting forever.
"Nothing
in life is constant except change itself"
If we take a look at the Euro-Goldprice
one can see the complaining Europeans about a gold price that
was not at all in a boom but moved in a most boringly fashion
sideways.
If the POG breaks the dominant
price influencing power of the Dollar, one can see this event
(still) at the Euro-Goldprice ("still" because the
Euro has not (yet) established its own momentum and correlates
virtually perfectly negative with the Dollar - which trend also
is not lasting forever as the European Central Bank might wish
a depreciation as well - should the Euro rise to a general "economic-damaging"
level).
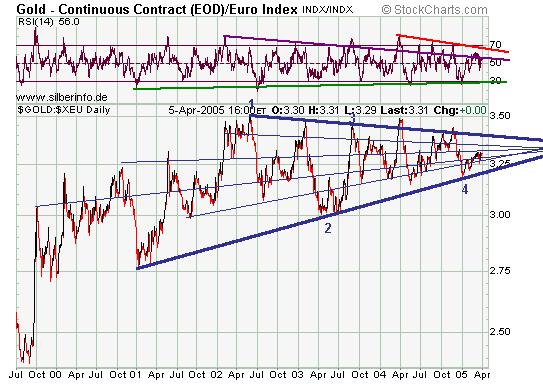
- The Euro not only is moving
sideways but doing so in a triangular formation fashion.
- 4 waves are already finished
whereby the impulse movement started which is trending to the
upside without having breached the lower leg. This is a first
bullish signal.
- The Euro-POG must break the
upper leg with the current wave whereupon a strong and sustainable
rise would be the result.
- By having finished 4 waves,
the Euro-POG might be already in a sustainable boom phase meaning
that the Dollar-POG has already decoupled itself from the dominant
influencing power of the Dollar. Because there are no signs that
the Euro is decoupling itself from the Dollar, it only can be
the POG which is breaking the Dollar chains.
The POG correlates nearly perfectly
negative with the Dollar whereby the Dollar is dominating the
movements. That's why one needs to look at the Dollar if wanting
to make a statement about Gold. This (seemingly automatic) approach
became a trend within the analyzing gold camps. But the danger
of a trend is that there can be a new trend.
The
Trend is your Friend!
Friends come and go!
Remember when the Dollar started
its new downtrend?
Correct: In the beginning of
2002:
But the gold price began its
new uptrend already in the beginning of 2001.
Remember what the (daily) dominant
gold price influencer was between 2001 and 2002?
Correct: It was the falling
U.S. stockmarket.
"When
the wind blows it extinguishes the candle but fans the fire"
Arabic saying
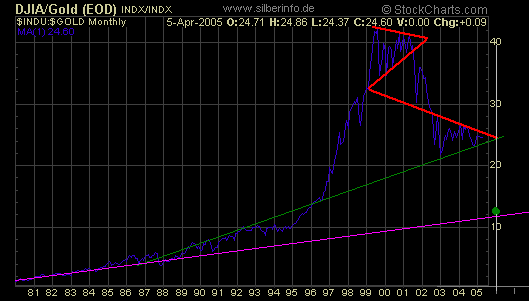
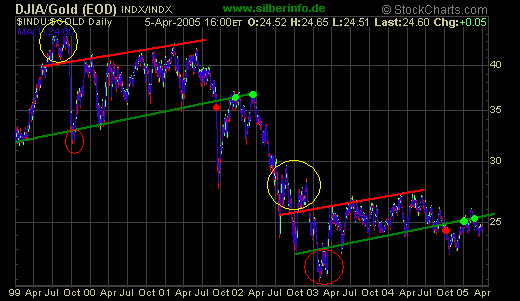
At the bottom of the above
chart (but as well on the full chart below) one can see the POG
relative to the Dow Jones since the end of 1999. Between 2000
and 2001 the movements of the POG and the Dow Jones were balanced
and thus trending sideways. This sideway consolidation stopped
with the beginning of the stockmarket correction. The POG rose
on days when the stockmarkets fell and fell when the stockmarkets
rose. When the Dollar began to fall in 2002 as well, the
POG accelerated even stronger.
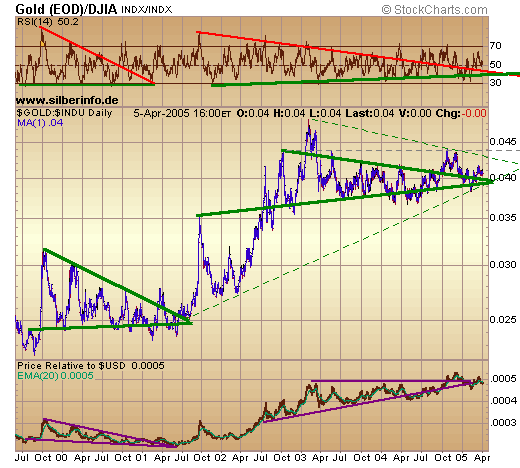
- The POG is consolidating again
sideways against the Dow Jones since the beginning of 2003 meaning
that in tendency they move equally.
- It was no unusualness that
the Dow Jones rose sharply in 2003 hand in hand with the POG.
The reason for the rise of the POG was found with the depreciating
Dollar.
- But now the Dow Jones could
- once again - dominate the movements of the POG. Namely the
POG relative to the Dow Jones is located - as in the beginning
of 2001 - at the end of a triangle.
- The price already starts rising.
Another explosive thrust is probable.
- Beware that a pullback to
the apex is always possible and that there is still some room
left.
To evaluate better if this
relative POG rather thrusts to the up- or downside, firstly we
take a closer look at the Dow Jones:
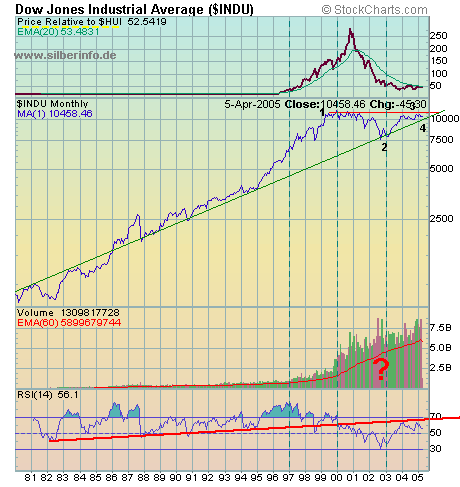
This (still) popular stockmarket
index is moving in a sharp uptrend since 1980 which paused after
20 years in the beginning of the new millennium and consolidated
sideways. The "crash" was relatively seen rather a
correction to the (green) long-term uptrend channel. A "real"
crash might yet to come as enough potential exists because the
sideways consolidation was in the form of a triangle. The lower
leg is currently running close to the 10,000 points. If this
upward trend is being touched, then 4 waves will be completed
within the boundaries. The index can then start crashing any
time. But it also can move up again and breach the upper leg,
break out and pull back to the apex from which point will be
decided if a sustainable boom or crash will occur.
To judge the state of the stockmarkets
better, let's take a closer look at the Dow Jones first:
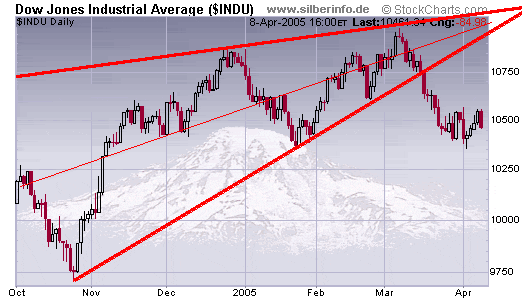
- After 4 waves the lower leg
had been breached in March and the index began to fall.
- The 10,000 mark important
psychological support probably at the same time with the long-term
uptrend channel (see chart before)
Now let's take a look
at the long-term value of the Dow Jones calculated in Gold (Dow-Gold-Ratio),
where one can see 3 overreactions (Hype, Crash) relatively to
the (grey) long-term uptrend since 1900. Every hype corrected
all the way down to the grey trendline. The hype of the 1980s
and 1990s is still not corrected fully when compared to the previous
two.
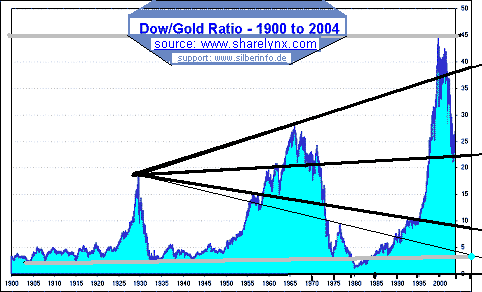
To evaluate the time of a potential
next crash, we will take a closer look at the last hype since
the 1980s:
- The formation of the top took
3 years.
- The strong retracement took
place in 2001.
- The current sideways movement
lasts now almost for 3 years and is increasingly pressured by
the red and green trendlines to decide for a new trend.
Now if we take these 2 consolidation
periods closer under our magnifier, one can see similarities:
Relative to the Nasdaq, the
POG is as well at the end of a 2* years sideways consolidation
as the upper leg has been broken recently:
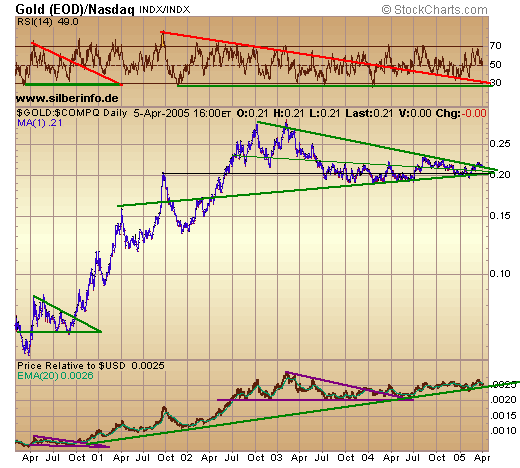
The Nasdaq itself is already
falling down of a triangle since the beginning of 2005:
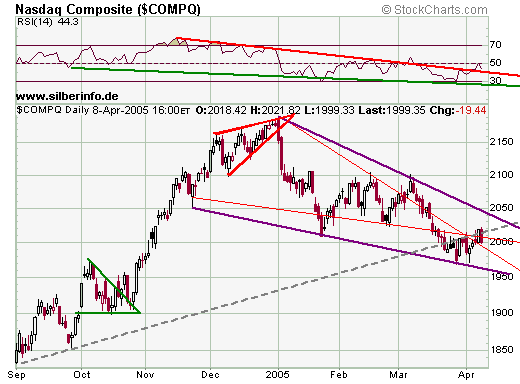
- In April there was an intersection
of 3 trendlines and the index touched it from the downside what
can be valued negatively.
- Only if the Nasdaq closes
above these 3 trendlines and breaks the upper leg a bullish signal
would be generated.
- After 4 waves within the violet
triangle the impulse movement can breach the lower leg any time
and let the index crash.
The following 3 concluding
stock charts might reflect the current state of the popular stockmarkets:
- The accounting scandals take
a change in trend: Financial statements are not only manipulated
to the upside but as well to the downside: Possibly out of fear
that their renunciation of their core business towards speculation
in the derivatives market could be noticed. Taking then a closer
look at these numbers would probably show how the financial market
worldwide (thanks to the globalized markets) is endangered because
of their excessive exposure in the derivatives markets.
But even other traditional
enterprises like General Motors or Ford face increasing problems
in operating profitably in their original business segments.
The total debt of Ford ($100 billion) and General Motors ($300)
equals the total federal debt of Canada.
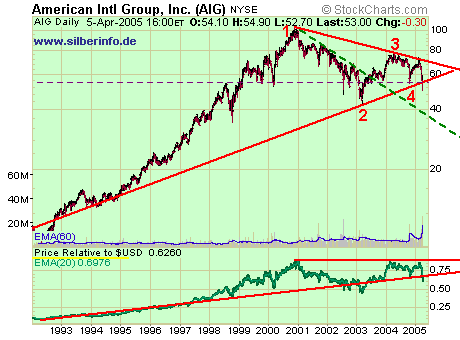
Accounting scandal at the biggest
American insurance company AIG (American International Group),
which is also known as "the Godfather of Gold & Silver
Leasing" (AIG dominates Comex trading as the biggest clearing
house):
29th March, 2005:
Greenberg
resigns as Chairman of the AIG Board
A new dynamic leadership at
AIG wouldn't hurt the company, but what concerns the market is
that the resignation of Greenberg might be a sign that more scandals
will come to the daylight. Who knows what AIG has done to maintain
its vibrant profit growth?
Some people are even saying
that AIG is nowadays nothing else but a vast Hedge Fund.
17th February, 2005
Greenspan
warnt vor Fannie Mae & Freddie Mac
"The Fed's chairman, Alan
Greenspan, has urged Congress to do something to rein in America's
two monster mortgage-finance agencies, Fannie Mae and Freddie
Mac, before they put the country's financial system at risk."
"Fannie Mae and Freddie
Mac, the twin titans of America's mortgage markets, think of
themselves as big, friendly giants. They stand behind the mortgages
of around three-quarters of America's households-they "make
home possible," as Freddie Mac likes to put it. Their circle
of friends does not, however, extend to the Federal Reserve and
its chairman, Alan Greenspan. On Thursday February 17th, he told
Congress that by letting these two agencies grow unchecked, "We
are placing the total financial system of the future at a substantial
risk." Very big but not so friendly, these giants could
soon loom over America's financial skyline like Godzilla and
King Kong." (2)
"The combined portfolios
of the two federally chartered companies exceed $900 billion.
Greenspan added that, "if they continue to grow, continue
to have the low capital they have, continue to engage in the
dynamic hedging of their portfolios, which they need to do for
interest-rate risk aversion, they potentially create ever-growing
potential systemic risks down the road." Greenspan further
suggested that the companies could hold onto as many Treasury
bills as they choose, but elect not to since there is no spread
for them "to exploit." His suggestion is that the two
be limited to portfolios of no more than $200 billion."
(3)
5th April, 2005
Falcon
resigns as Director of Fannie & Freddie
Falcon: "The agency has
successfully dealt with serious problems at two of the largest
financial institutions in the world." ... "And we did
so in a manner that avoided disruption in our financial system,
while allowing both companies to continue fulfilling their vital
public mission."
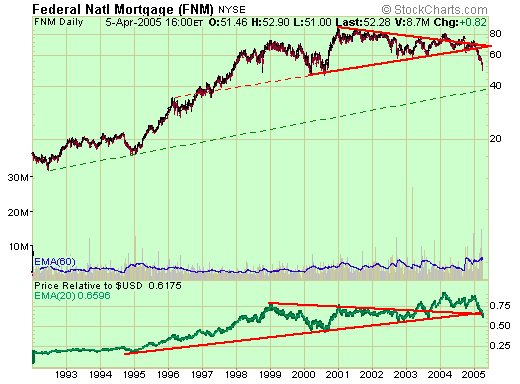
Greenspan further mentioned
during the testimony on February 17th that the real estate markets
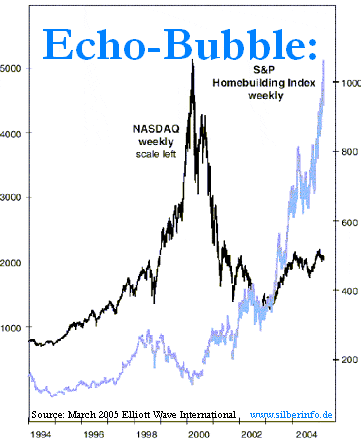
in various regions of the country would show all signs of a bubble.
References:
(1) Excerpt from
the song "The Wind of Change" by The Scorpions. Read
and listen to the full text of the song here:
http://www.screenpictures.com/cards/windofchange.html
(2) Article in
The Economist: "Building the American dream... or nightmare?"
February 18, 2005:
http://economist.com/agenda/displayStory.cfm?story_id=3686475
(3) Article by
Bill Mann: "Greenspan to Fannie: 'You're Too Fat!'"
February 18, 2005:
http://www.fool.com/News/mft/2005/mft05021807.htm
12 April, 2005
Stephan Bogner
email:
team@silberinfo.de
website: www.silberinfo.de
321gold Inc

|
